- Wealth Stack Weekly
- Posts
- Five types of asymmetry and why most portfolios have none of them.
Five types of asymmetry and why most portfolios have none of them.
How to make bets with greater upside than downside.

Hi ,
Let me start with something that might sound counterintuitive coming from a guy who writes a newsletter about alternative assets and private markets: Diversification, compounding, and discipline are the secret. Full stop. They always have been.
Every wealth-building story that stands the test of time comes back to those three principles. If you've spent the last decade or two grinding your income higher, saving aggressively, and investing consistently into a diversified portfolio, you've been doing the right thing. I mean that.
Here's where it gets interesting.
Until last week, the S&P 500 was flat in 2026. If you own the index, ten weeks into the year you’re more or less running in place. Even after this week’s geopolitical selloff, your account looks roughly the same as it did on January 1st. You might be worried or just sigh, and move on with your day.
But underneath the surface, the guts were churning.

Energy stocks are up nearly 20% year to date. Materials are up 15%. Industrials up 13%. Meanwhile, tech and consumer discretionary (the sectors that carried the market for the last three years) are down 4-5%. In a single eight-day stretch in mid-February, 115 S&P 500 stocks dropped 7% or more in a single session. The index barely flinched. If you own the index, you experienced none of this. Not the pain and not the gain. You got the blended average of a massive rotation which netted out to roughly zero.
So imagine two investors sitting side by side. Working with the same economy. Same six weeks. Same headlines. Except one is flat and the other is up double digits. The difference is the shape of their bets. One is holding symmetric exposure — broad, blended, structured to capture the average. The other is positioned asymmetrically — in specific sectors, private markets, and in assets where the upside and downside aren't mirror images of each other.
Same principles. Same discipline. Dramatically different fuel.
I think about this constantly. Compounding in a symmetric market has a mathematical ceiling. It’s why 98% of millionaires never cross $5 million in net worth. They're not doing anything wrong. The engine is working but the fuel only takes them so far.
You can be the most disciplined, most diversified, most patient investor in the world, and if every position in your portfolio has roughly equal upside and downside, there's a cap on what those principles can produce.
What if you fed the engine with a different type of fuel? Apply that same discipline to a portfolio that includes assets where you can lose 1x but make 5x or 10x. Take that same patience to investments with a 7-10 year time horizon where illiquidity is a key feature. And apply real diversification — not twelve mutual funds that all correlate on the same flat day — across asset classes with genuinely different return profiles.
Same engine. Dramatically different destination.

I used the word "asymmetric" in my weekly team meeting, and our analyst asked me how I actually think about it. What specifically makes something asymmetric versus just a good investment? It's a simple and fantastic question. So I sat down and outlined it, and five distinct layers emerged. To illustrate them, I'm going to run a single asset class through all five to demonstrate how the layers stack and compound. An asset we deployed real capital into last year.
In this issue, you’ll find:
The Five Layers of Asymmetry and how they apply to our 2025 bet in energy
Our map of asymmetry across private markets.
A practical playbook for building asymmetry into your portfolio
Let’s get into it,
— Walker Deibel
WSJ & USA Today Bestselling Author of Buy Then Build
Founder, Build Wealth

SHIFT YOUR STACK
Your portfolio is too symmetrical. Let’s re-shape it.
Asymmetric.
I've used that word hundreds of times — in conversations, in pitch decks, even in this newsletter. I’ve seen it used thousands of times by pundits and industry analysts. But I'd never sat down and systematically outlined how I think about asymmetric bets. In doing so, I built a framework with five distinct layers that will change how I evaluate every investment I make from here on forward.
To show you how the layers stack, I'm going to run a single asset class through all five.
Asymmetry in Action: Energy
Our largest fund position last year was called BuildEnergy I. Now we didn't stumble into energy by accident. We saw all five layers of asymmetry converging, and we moved in.
When multiple asymmetries compound in one position, the math gets absurd. That's where fortunes are actually made.
At its core, an asymmetric investment is simple. The upside is a multiple of the downside and the probability-adjusted expected value is meaningfully positive. Basically, you can make a lot more than you can lose.
Probability is key. A lottery ticket has a massive upside for the winner, but the expected value is negative. That's not the kind of asymmetric we look for — that's just gambling with bad math.
Right now, energy has all five asymmetric layers. Let’s unpack them one at a time.

Layer 1: Structural Asymmetry. Capped Downside, Uncapped Upside
This is the foundation. You need to be in positions where you can lose 1x but make 5x, 10x, or 50x.
Think about what most of your portfolio looks like. You own the S&P at roughly 22x earnings. In the best years it’s up, 20-30%. In the worst years, you’ll have a 20-40% drawdown that takes a long time to recover.
The upside and downside are roughly equal. That's symmetrical. And that's what almost every "diversified" portfolio in America looks like.

Now, consider our current energy demands. U.S. electricity demand is forecast to rise dramatically in the coming years (~25 % by 2030, ~78 % by 2050). The Department of Energy, the major utilities, and every credible grid analysis published in the last 18 months all point to this conclusion.
By 2030, the electricity demand of global data centers is projected to more than double, exceeding the current total electricity consumption of Japan (that’s like 945 terawatt-hours in case you are curious). Data centers, reshoring manufacturing, electrification of transport — every major economic trend in the next decade points to one thing: power.
The downside on energy infrastructure is bounded by physical necessity. People need electricity. Factories need electricity. Data centers need electricity. Demand isn’t going anywhere. It barely even dips. The floor is high.
The upside? If you're positioned in the companies building generation, transmission, and grid interconnection for a generational buildout, you're riding a demand curve driven by arithmetic, not sentiment. The world knows what it needs to run. The question is who is building it.
High floor, wide-open ceiling, demand driven by physics. Yes, that payoff shape is structural asymmetry in its purest form.
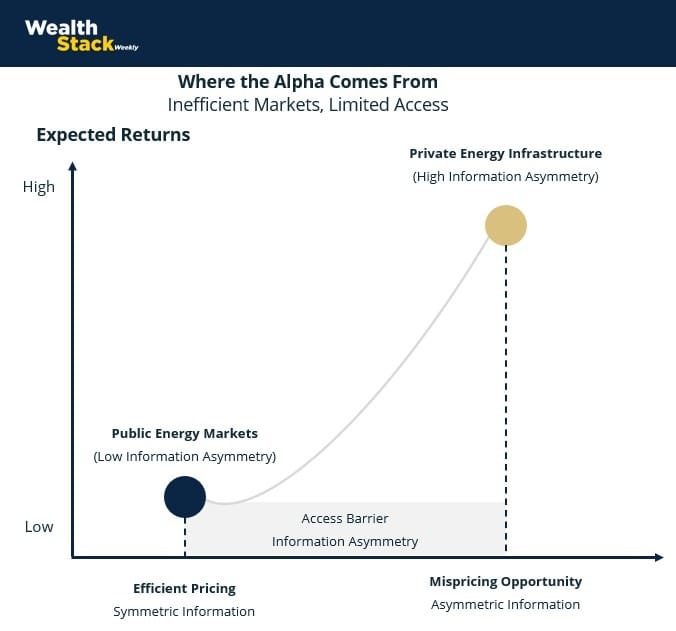
Layer 2: Informational Asymmetry. Inefficient Markets, Limited Access
The shape of the bet matters. But the deeper source of returns is operating in markets where the pricing is wrong — and where most capital can't go to correct it.
Public energy markets are efficient. Thousands of analysts cover every utility, every power producer, every clean energy SPAC. Information moves in milliseconds. Prices reflect consensus. You, sitting at your brokerage account dashboard, have the same information as everyone else at the same time. Efficient markets are a wonderful thing for the economy. They're a terrible place to find asymmetry.
Inefficient markets are the opposite — and they're inefficient because access is limited. The two go hand in hand. When fewer participants can evaluate an opportunity, pricing stays loose. When pricing stays loose, the people who can access it earn a premium. The inefficiency and the access barrier are the same mechanism.
Private energy infrastructure is one of the most inefficient markets in the U.S. right now.
Drop below the public surface and the landscape inverts completely. Permitting timelines. Interconnection queue positions. Off-take agreements with hyperscalers who need power yesterday. Relationships with landowners, landmen, utilities, and state energy offices. The ability to evaluate which projects get built versus which will die in the queue.
Looking at the numbers, according to Lawrence Berkeley National Laboratory's latest data, nearly 2,300 gigawatts of energy projects are actively sitting in U.S. interconnection queues right now. Only about 13% of projects that have entered those queues over the past two decades ever reached commercial operation. Knowing which 13% — that's the edge. And you can’t check Bloomberg, the information lives in relationships, operating experience, and boots-on-the-ground knowledge of how energy projects move from paper to power.
This is what an inefficient market looks like up close. The access barrier keeps most capital out, and that's exactly what keeps the returns in.
Layer 3: Time Horizon Asymmetry. The Patience Premium
Time is the most underrated layer. And energy is a perfect illustration of why.
Most capital is managed on quarterly cycles. Fund managers live and die by 90-day performance windows. Retail investors check their portfolios daily — sometimes hourly — and proceed to make emotional decisions.
Remember last week? Markets dropped hard. Billions of dollars moved because people couldn't sit still among geopolitical headlines. Then everything hit all-time highs. All that volatility, and the fundamentals hadn't budged an inch.
Energy infrastructure is a 10-20 year buildout. A natural gas plant takes 3-5 years from permitting to generation. Grid transmission upgrades are a decade-long process. Nuclear — especially small modular reactors — has a development timeline measured in administrations, not quarters.
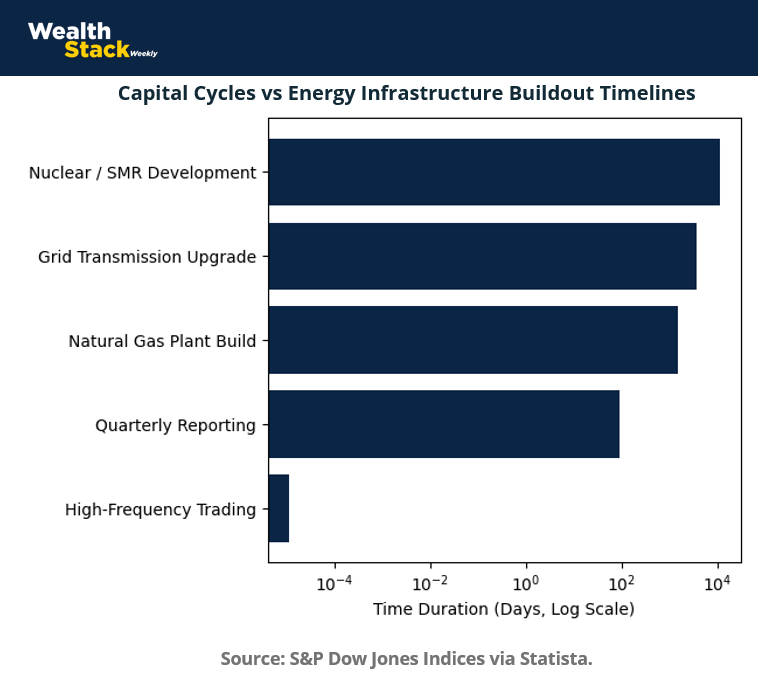
Energy’s winning capital commits for the long haul. And here's what’s beautiful. Most capital can't accommodate that. Institutional investors need quarterly marks. Public market investors need liquidity. Even most PE funds are working on 5-7 year timelines that don't align with the full infrastructure cycle.
If you can lock up capital for 7-10 years and let the buildout unfold, you are buying patience at a discount. The illiquidity everyone else sees as a bug? That's your premium. While the S&P swings 3% on a Tuesday because of a CPI print, your energy infrastructure position is doing what it did last month and the month before — generating power, collecting contracted revenue, and compounding quietly in the background.
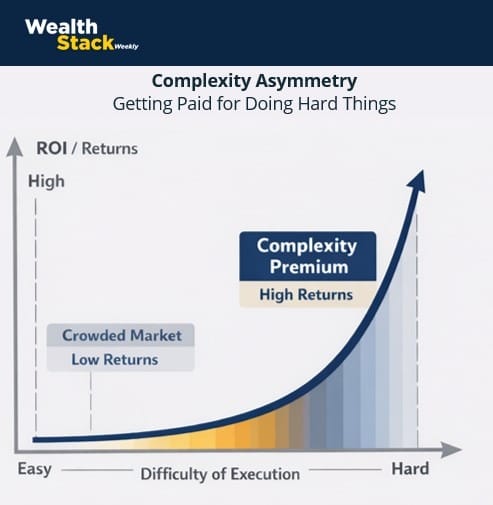
Layer 4: Complexity Asymmetry. Getting Paid for Doing Hard Things
There's a rule that’s never failed me. The harder something is to do, the fewer people will do it. And the fewer people who do it, the better the economics.
Energy infrastructure is hard.
It has to navigate federal, state, and local permitting across three jurisdictions.
Manage interconnection agreements with a utility that has a two-year backlog. Secure off-take contracts from hyperscalers whose power demands are growing faster than anyone can build. Now do all of that simultaneously, on a timeline, with capital at risk.
That complexity is the moat.
A clean SaaS company? Anyone can underwrite it, which is why you'll pay 15x revenue for the privilege. An energy project that requires environmental review, community engagement, grid engineering, and utility negotiation just to get to construction? Most capital walks away at the term sheet.
But the operators who live in that complexity know which state energy offices move fast, which interconnection positions are worth fighting for, which projects will actually survive the queue. In doing so, they’re buying future cash flows at a discount to what those same assets would command in public markets.
Our base case projections for BuildEnergy I, a $10 million fund, show returns of more than $100 million to investors over 10 years. That’s the complexity premium.
Opportunities like this tend to be overlooked because they require extra work, more coordination, and patience. When fewer investors pursue complex assets, the potential return for those willing to navigate them increases.
And that premium is widening, because the demand is accelerating faster than the industry can professionalize to meet it.
Layer 5: Behavioral Asymmetry. The Uncertainty Edge
This is the layer that truly seals it all.
Watch what happens when someone hears "energy infrastructure." Their brain immediately pattern-matches to one of two camps: a political debate about climate, or a bet on which technology wins — solar vs. wind vs. nuclear vs. natural gas. They get lost in the narrative. They argue about policy. They wait for "clarity."
Meanwhile, the demand curve doesn't care about your politics. Data centers need power regardless of which party controls Congress. Manufacturing reshoring requires electricity whether you think tariffs are smart or stupid. The arithmetic is apolitical.
The behavioral edge is the ability to see past the narrative noise and focus on the fundamentals. Every dollar of capital stuck debating policy instead of deploying into infrastructure is a dollar that isn't competing with you. Every investor waiting for the "right" political environment is creating space for the investor who recognizes that the demand exists independent of the environment.
The same behavioral trap plays out everywhere — in stocks, in real estate, in business acquisitions. People wait for certainty. Certainty never comes. The investors who build real wealth are the ones who act on high-conviction analysis while everyone else is still arguing about headlines.
Let’s stack it all
Asymmetric layers build a compounding stack.
Each layer is an advantage. Sure structural asymmetry alone is better than what your index fund offers and informational asymmetry alone is worth pursuing. But when you find a position where all five are running simultaneously the market has made a category error in its pricing.
If you want to see how else asymmetry takes shape, dig in and read the full report on these 5 asymmetries HERE.
THE ASYMMETRY MAP
Where Else Does Asymmetry Hide?
Energy isn't the only place where asymmetry lives. The five layers show up across private markets — though stacking all five at full strength in a single position is rare. So you need to know where to look and how to make them work together.
We built a grid to help you see which layers are dominant in each asset class. A blue checkmark means the layer is meaningfully present. Yellow checkmarks mean it's a primary driver of returns.

Real Estate: Led by Structural + Time Asymmetry
Acquire an underutilized neighborhood already generating real economic activity. The kind with rising GDP, long-term demographic tailwinds, and a coherent placemaking thesis no one has executed yet. Lock in fixed-rate debt. Let rents reprice as the neighborhood matures around you. Downside is capped by replacement cost and existing cash flow. Upside compounds over a decade as the strategy clicks into place. Time does the heavy lifting.
But real estate touches more than two layers. The placemaking thesis itself is an informational edge — seeing a neighborhood's trajectory before the market prices it in. Managing zoning, entitlements, tenant mix, and capital improvements across a portfolio adds genuine complexity that keeps passive capital on the sidelines. And behavioral asymmetry shows up every cycle: when sentiment turns negative on real estate, disciplined buyers acquire assets at discounts that look absurd three years later.
Private Credit: Led by Informational + Structural Asymmetry
Lend against cash-flowing businesses at conservative loan-to-value ratios in markets the big banks have structurally abandoned. Downside is protected by collateral and covenants. Upside comes from yield plus origination economics that institutional lenders can't access at this scale. The edge comes from operating in a market most capital can't reach — an inefficient market where limited access is the source of the premium.
The complexity layer is real here too. Sourcing, underwriting, and servicing loans to small and mid-sized businesses is operationally demanding work. It's the reason the banks left in the first place. The unit economics don't work at their cost structure. For operators built to work at this scale, that complexity is a feature. And time asymmetry shows up in the holding period: patient capital that can commit for the full loan term earns a premium over lenders who need the liquidity.
Private Equity: Led by Complexity + Behavioral Asymmetry
Invest in businesses sitting inside fragmented industries or carrying IP the market hasn't figured out how to price. Most capital avoids the operational lift. Most analysts don't cover the niche. The operators who live in that complexity buy future earnings at discounts public markets wouldn't tolerate for a week. The willingness to do hard things is the moat.
But private equity is also where structural asymmetry is at its most tangible. Buying a business at 3-4x EBITDA with a bounded equity check and uncapped operational upside — that's the textbook definition of capped downside and disproportionate upside. Add in proprietary deal flow and deep industry knowledge — informational asymmetry that never touches a public listing — and time horizons of 5-10 years that outlast most competing capital, and PE starts stacking layers fast.
Every private asset class touches multiple layers. The grid highlights where the dominant edges live — the layers doing most of the work in generating outsized returns. Energy is unique because all five layers operate at full strength simultaneously.
That's the whole point of building across private markets rather than concentrating in just one sector. Where one asset class has a gap, another fills it. When the layers compound across a portfolio, the math starts to look different from anything a symmetric allocation can produce.
THE PLAYBOOK
How to Introduce Asymmetry Into Your Portfolio
Frameworks are great. When they change your behavior, even better.
It’s not complicated to start layering asymmetry into your portfolio. We outlined the steps to get started.
Step 1: Score what you own.
Pull up your portfolio. Every position, every fund, every account. For each one, ask these questions:
Does this position have structural asymmetry?
Is the upside meaningfully larger than the downside?
Do I have an edge that most investors in this same position don't have?
Is my time horizon longer than the typical holder of this asset?
Is there a complexity barrier keeping other capital from competing with me here?
Am I behaving differently than the majority of investors in this space or aligned with consensus?
Be honest. A broad index fund scores zero on all five. A target-date retirement fund scores zero. Most people who do this exercise realize something uncomfortable: they don't have a diversified portfolio. They have a uniform portfolio. Positions that all score the same. Different tickers, same shape.
Step 2: Find your asymmetric allocation ceiling.
What percentage of your investable capital can you commit for 7-10 years without it changing how you live?
Not what you're theoretically willing to lock up. What you can actually lock up and never think about, never need for an emergency, never panic-redeem when you suddenly want liquidity everywhere.
If you are sitting with a $2-5M net worth, that number is somewhere between 15% and 30%. Maybe more if your W-2 income covers your lifestyle with margin to spare. Maybe less if you're carrying obligations that require liquidity.
Whatever it is, that's your asymmetric allocation.
The portion of your portfolio that can operate on different rules. Longer time horizons. Illiquid structures. Complexity premiums. All five layers are seen working simultaneously.
The rest of your portfolio? Keep doing what you've been doing. Diversified, disciplined, compounding. You don’t need to replace the symmetric engine, just build on top of it.
Step 3: Understand what you're actually looking for.
Here's where most people stall. They understand the framework and their allocation. But they open their brokerage account and don’t find it.
There's no "asymmetric investments" tab on your brokerage app. Private energy infrastructure doesn't show up in an ETF screener or get listed on Morningstar.
The access barrier is REAL. And it's part of the asymmetry. (See layer #2) The inefficiency of these markets exists because these markets are hard to access.
So what should you actually look for?
Operators with skin in the game who invest their own capital alongside yours. Track records you can verify against actual fund performance, not backtested models. Structures where the incentives align and time horizons that match the underlying asset. If someone is offering you a liquid vehicle for an inherently illiquid asset class, ask yourself what you're paying for that convenience.
This is how I've been building my own portfolio for the last several years. Pizza, by the slice. Private holdings across multiple asset classes, each one selected because the asymmetry profile — not the pitch deck — justified the commitment.
Step 4: Begin to Build Access
Now that you know what you’re looking for, how do you find it?
Our mission at Wealth Stack Weekly is to help private market investors navigate the markets with research, insights and frameworks. Our firm, Build Wealth, actually provides access. We know access is a key barrier for retail investors (again, see ‘Layer 2: Informational Asymmetry’) because it requires building a network and trust. This is why Build Wealth isn’t just real estate, or PE, credit or energy.
We favor diversification across asset classes and operators.
Our profiled fund, BuildEnergy I, was our largest allocation last year with cash flowing oil and gas wells with infill drilling opportunities over a decade-long accumulation strategy. Our real estate equivalent, BuildLegacy, is our approach to acquiring and placemaking an entire neighborhood that’s already generating $3b in annual GDP and primed for a cohesive strategy. Then there’s BuildInteractive, a PE allocation in Delphi Interactive, which captures the world’s largest franchisable IPs (007 and FIFA) with the largest entertainment industry in the world (gaming). We’ve already struck deals with Netflix and Microsoft.
In every case, I invest my own cash first. My family's capital is in these funds alongside our investors. Up until recently, I was the single largest investor in our funds overall. The structure is designed the way I'd want it if I were on the other side of the table — because for years, I was. The idea is simple: a family office structure where we all get better returns together than any of us would get alone. My structure, our capital, shared upside.
Check out our current offerings at buildwealth.investnext.com.
If you're someone who wants to close that gap and wants to go next level on this — I've got a couple of big announcements coming soon for something that, frankly, has never existed before. Stay close. More on that soon. (And yes I hid this easter egg 3,400 words into the newsletter ;). Hit reply and type the word “ACCESS” if you already know you’re ready to build deeper access to private markets.)
WEALTH STACK REBELLION

"The big money is not in the buying and selling, but in the waiting." — Charlie Munger
Did this land in your inbox via a friend or colleague? Subscribe to get your own weekly insight into private markets.
Already a reader? Help other investors open their eyes to the private markets and forward this to someone who would value the insight. Or hit reply to tell us what you think.