- Wealth Stack Weekly
- Posts
- Momentum in Motion: How the Middle Market Became the Engine of Private Deal Activity
Momentum in Motion: How the Middle Market Became the Engine of Private Deal Activity
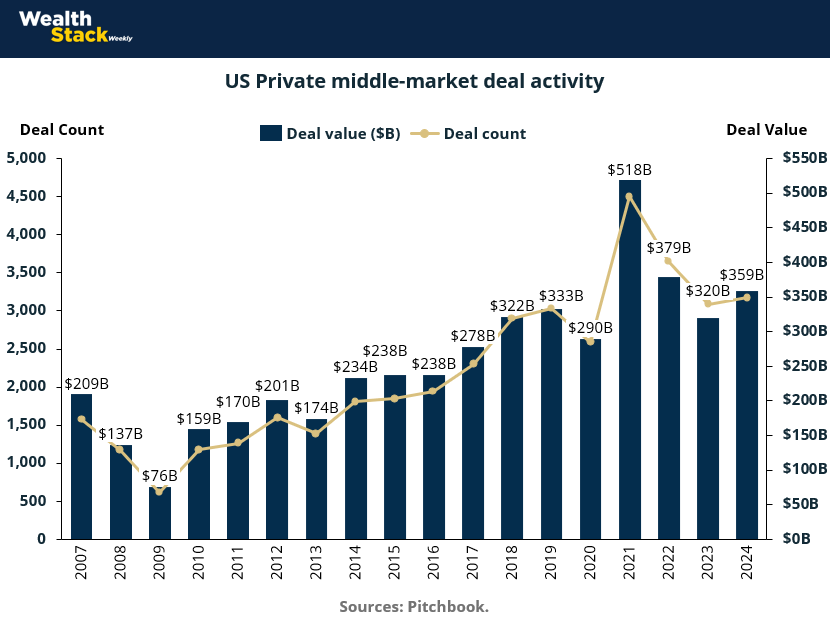
Over the past 15 years, the U.S. middle market has evolved from a niche segment into a defining force in private capital deployment.

As shown in the chart, deal values have expanded from roughly $76 billion during the 2009 trough to more than $350 billion by 2024.
Even with cyclical slowdowns, activity has consistently rebounded—underscoring the structural resilience of this segment. For investors, the expansion of deal count and aggregate value signals a growing pool of enterprises that have crossed the $3–5 million EBITDA threshold—large enough for credible underwriting, yet small enough to remain outside the crowded institutional sphere.
This trajectory reflects the heart of the premise: once companies achieve a baseline of operational stability—predictable cash flows, professionalized management, and scalable infrastructure—they become significantly easier to underwrite.
Sponsors increasingly target these firms because they combine the risk-adjusted profile of established businesses with the upside of continued operational optimization. The surge in deal count across the past decade shows that this “sweet spot” is not theoretical—it has become a core focus for private equity and family office strategies alike.
Importantly, this growth has not yet translated into full institutionalization. The deal ecosystem remains fragmented, local, and founder-influenced. While aggregate volumes mirror large-cap trends, transaction structures, diligence depth, and access to capital vary widely across markets. In short, the middle market has achieved scale but not saturation—a distinction that explains why investors continue to see attractive entry points even amid rising valuations.

Key takeaways for investors:
Sustained expansion: Total deal value increased nearly fivefold since the 2009 trough, highlighting the durability and maturation of the segment.
Rising underwrite quality: Growth in deal count aligns with a broader universe of companies exceeding the $3–5 million EBITDA mark—now numerous enough to support consistent sponsor activity.
Attractive maturity balance: Middle market businesses exhibit institutional-grade stability without the compressed multiples of large-cap peers, reinforcing the “not institutional yet” premise.
Countercyclical resilience: Even post-2021 slowdowns stabilized above pre-2018 levels, suggesting a structural, not cyclical, elevation in middle-market participation.
Fragmented but scaling: The continued proliferation of deal flow supports the idea of a market segment large in volume but still developing in standardization—an ideal landscape for skilled underwriters seeking inefficiencies.
Beyond the Cycle: Structural Strength in Middle-Market Deal Activity
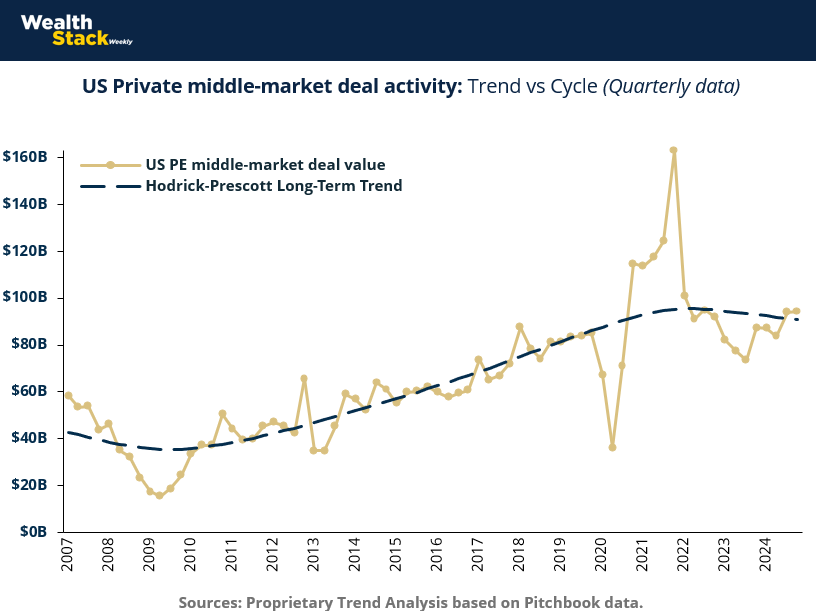
When viewed through a cyclical lens, the U.S. middle market reveals not volatility, but endurance. Quarterly deal values may oscillate with broader macro conditions, yet the Hodrick–Prescott trendline illustrates a clear and steady upward trajectory over nearly two decades.
Each downturn—whether the 2009 crisis, the 2020 pandemic shock, or the 2022 liquidity reset—has been followed by a sharp recovery and an even higher baseline of sustained deal activity. This pattern underscores a critical insight for investors: middle-market businesses not only weather economic turbulence but often emerge from it with stronger fundamentals and more efficient capital structures.
At the core of this resilience is the segment’s composition. Once businesses exceed $3–5 million in EBITDA, they transition into a stage where underwriting becomes data-driven and repeatable, yet agility remains intact. These companies possess recurring cash flow and credible management bandwidth, allowing sponsors to execute through cycles without the rigidity of institutional-scale governance. The result is a dynamic equilibrium—firms mature enough to be underwritten confidently, but still nimble enough to pivot in response to shifting demand or capital conditions.
For investors, the chart’s message is both strategic and timing-based. The long-term trendline reflects the structural expansion of the investable universe, while cyclical dips represent opportunity windows—moments when valuation compression and capital scarcity create attractive entry points. In essence, the middle market functions as a cyclical participant but a secular winner: volatility at the surface, compounded stability underneath.

Key Takeaways for Investors:
Secular growth amid cycles: The Hodrick–Prescott trend confirms an enduring 15-year upward trajectory in deal value—proof that middle-market opportunity is structural, not cyclical.
Attractive re-entry points: Historical dips (2009, 2020, 2023) consistently preceded multi-year upswings, marking the middle market as a countercyclical buying opportunity.
Resilient underwriting class: Companies in the $3–10M EBITDA band are large enough for diligence-backed underwriting but small enough to remain flexible through downturns.
Diversified exposure: The segment’s fragmentation shields it from concentrated shocks; downturns in one vertical (e.g., industrials or consumer) are often offset by strength in others.
Alpha through inefficiency: While institutional capital still focuses on mega-deals, mid-market investors exploit information gaps, sourcing advantages, and operational uplift unavailable at larger scales.
Long-term compounding effect: Trend growth reflects cumulative gains in both deal quality and sponsor sophistication—confirming that the middle market has graduated from opportunistic to strategic allocation territory.
The Rhythm of Opportunity: Reading Middle-Market Cycles Beyond the Trend
While aggregate growth paints a picture of long-term expansion, the true dynamics of the middle market emerge when we strip away the trend. The de-trended business cycle view exposes a pattern of recurring but bounded oscillations — bursts of above-trend activity followed by moderate contractions. These waves are not random; they trace directly to macro-liquidity cycles, cost of capital shifts, and risk appetite within private markets. Importantly, even the sharpest downturns (2009, 2020) were followed by disproportionately strong rebounds, suggesting that market pullbacks serve more as recalibrations than structural resets.
For middle-market sponsors, these cyclical swings are not deterrents — they are catalysts. Once a company surpasses the $3–5 million EBITDA mark, its risk profile stabilizes enough for disciplined underwriting, allowing investors to act counter-cyclically.
The chart underscores this: while institutional capital often retreats in contractionary phases, mid-market investors with operational control or flexible mandates can accelerate deployment, capturing mispriced opportunities before the next upswing. This counter-cyclical advantage is a defining edge of the segment — one that depends on depth of diligence and agility rather than sheer capital scale.
The takeaway is strategic timing. The middle market’s cyclical amplitude offers visibility into when to lean in and when to consolidate. Because this segment remains under-institutionalized, behavioral patterns are less synchronized with broader markets — enabling savvy sponsors to outperform through cycle timing, not just company selection. In essence, volatility here is not risk to be avoided; it is inefficiency to be harvested.

Key Takeaways for Investors:
Cyclicality within bounds: Volatility is frequent but contained — oscillations rarely extend beyond a 2-3 year horizon, implying that downturns are short-lived relative to trend growth.
Counter-cyclical deployment edge: Middle-market specialists often deploy capital most effectively during “below-trend” phases when pricing power and access dynamics favor disciplined buyers.
Operational alpha > market beta: The capacity to underwrite smaller, cash-flow-positive firms allows investors to generate returns independent of macro cycles.
Liquidity-driven cycles: Peaks align with expansions in credit availability, while troughs coincide with rate spikes or uncertainty — reinforcing the importance of flexible funding strategies.
Non-institutional dynamics: Unlike public or mega-cap markets, middle-market cycles are less correlated with macro indices, providing genuine diversification for multi-asset allocators.
Strategic patience pays: Rebounds from below-trend conditions consistently yield above-average entry vintages, supporting a disciplined, long-horizon investment rhythm.
Valuations at the Crossroads: Pricing Maturity Without Institutional Saturation
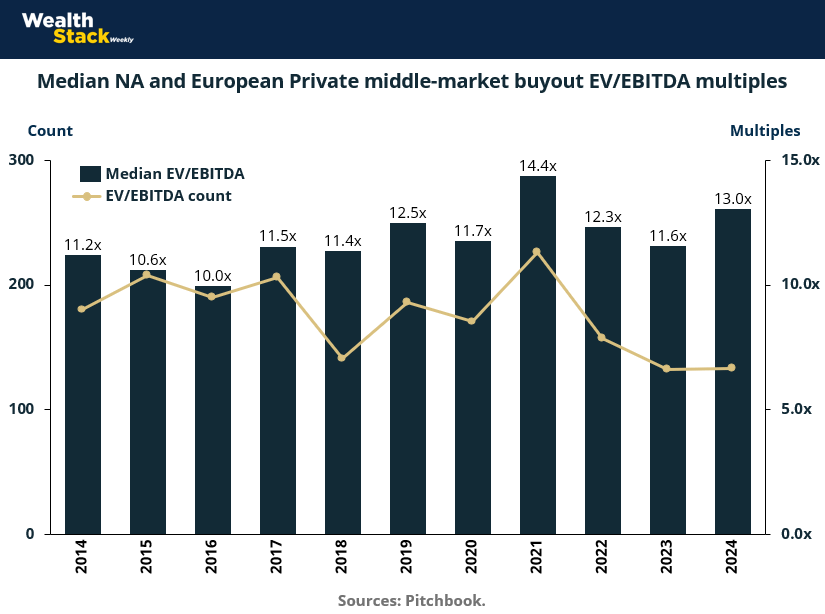
Over the past decade, middle-market buyout valuations have steadily converged with institutional pricing, yet the segment continues to retain its unique asymmetry between risk and reward. As shown in the chart, median EV/EBITDA multiples for North American and European middle-market deals have fluctuated between roughly 10x and 14x, with a cyclical peak in 2021 and a resilient rebound into 2024. While headline multiples suggest increasing competition, the underlying spread of valuations—particularly in deals sub-$10M EBITDA—remains wide, indicating room for alpha through underwriting discipline and operational enhancement.
This valuation profile perfectly aligns with the middle-market thesis. Once businesses cross the $3–5 million EBITDA mark, their risk profile becomes legible—cash flows are predictable, governance is in place, and management depth is measurable. Yet, these firms still lack the process standardization and investor crowding typical of institutional assets.
In essence, they command a premium over small-cap peers due to reduced execution risk, but they trade below large-cap valuations where pricing efficiency compresses returns. The result is a sweet spot—assets priced for growth, not perfection.
For investors, these valuation patterns highlight where the market is maturing and where it is not. The steady elevation of median multiples signals improved data transparency and sponsor sophistication, while the persistent dispersion reflects continued inefficiency in underwriting quality. This is precisely why experienced middle-market sponsors thrive: they can pay institutional-like prices for businesses that have yet to be fully institutionalized—extracting value through structure, not speculation.

Key Takeaways for Investors:
Valuation resilience: Despite macro volatility, median EV/EBITDA multiples held within a narrow 10–14x band, underscoring sustained sponsor appetite and disciplined pricing.
Maturity premium: Companies exceeding $3–5M in EBITDA attract higher multiples as underwriting risk declines—yet they remain cheaper than fully institutional peers.
Inefficiency persists: Wide valuation dispersion across deals suggests significant opportunity for multiple expansion through professionalization and margin improvement.
Post-peak normalization: Following 2021’s 14.4x peak, valuations re-centered near historical averages, implying a more rational market supportive of long-term entry points.
Operational upside over multiple expansion: The flattening of multiples shifts return generation toward EBITDA growth and strategic execution rather than passive market tailwinds.
Strategic implication: Investors should interpret valuation stability not as saturation but as maturation—the emergence of a market segment priced on fundamentals, not froth.
Diversified Depth: How Sector Balance Reinforces Middle-Market Resilience”
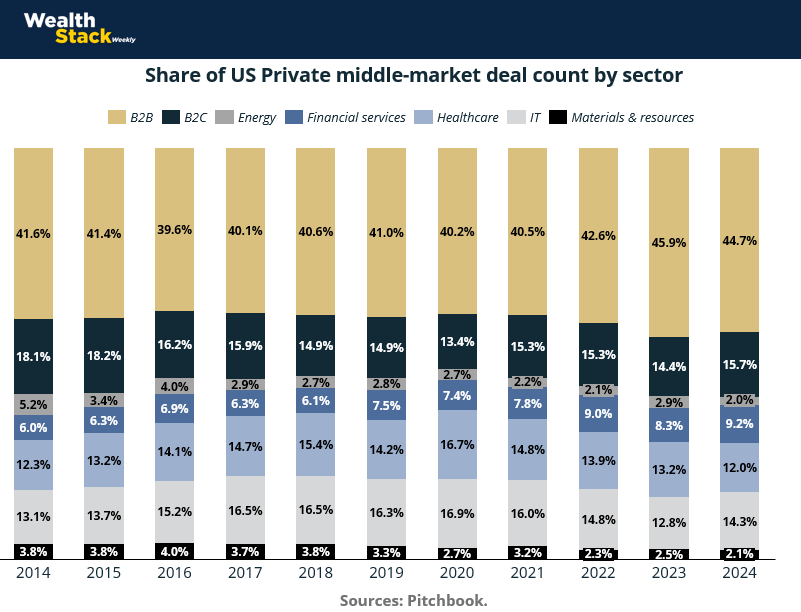
The composition of middle-market activity reveals as much about its resilience as the aggregate numbers themselves. Over the past decade, deal flow has diversified across industries while maintaining a stable anchor in B2B transactions, which consistently represent ~40–45% of total deal count.
Beneath this top-line stability, a quiet evolution has occurred: healthcare, IT, and financial services have steadily expanded their share, reflecting the shift toward service-oriented, cash-flow-generative businesses. These sectors, characterized by recurring revenues and scalable cost structures, align perfectly with the underwriting logic that defines the $3–5 million EBITDA threshold.
What this diversification signals is a structural maturing of the middle market—not through institutional consolidation, but through operational sophistication. The increasing weight of healthcare and IT implies that more businesses are crossing into “underwritable” territory—companies that exhibit the management discipline, reporting accuracy, and governance rigor previously confined to larger enterprises.
Yet, this diversification also underscores that the market remains far from homogenous; sector dispersion continues to create inefficiencies, valuation spreads, and asymmetric return profiles.
For investors, this sectoral breadth translates into resilience and choice. The middle market is no longer dominated by industrial or commodity exposures—it has become a cross-section of the modern economy, balancing defensiveness (healthcare, B2B) with growth potential (IT, financial services). Importantly, this evolution hasn’t institutionalized the space; rather, it has made underwriting more accessible and performance less cyclical. The mix demonstrates why the segment sits in its “goldilocks zone”: mature enough for analytical confidence, but diverse enough to remain inefficient and opportunistic.

Key Takeaways for Investors:
Sectoral resilience: B2B remains the core of the middle market, accounting for roughly 40–45% of activity, providing a stable backbone through cycles.
Structural evolution: Healthcare and IT have grown steadily to represent over 25% of total deals, signaling a pivot toward scalable, recurring-revenue models that align with disciplined underwriting.
Reduced cyclicality: The rising share of services-based sectors dampens exposure to industrial and materials cycles, enhancing downside protection.
Diversified alpha sources: Sectoral variety enables differentiated strategies—investors can balance yield-oriented plays in healthcare with growth in IT or financial services.
Evidence of professionalization: The growing representation of sectors that demand higher reporting and compliance standards demonstrates the operational maturity of middle-market firms.
Still not institutional: Despite diversification, the segment remains fragmented, founder-driven, and locally sourced—preserving inefficiency and upside potential for skilled sponsors.
Sources & references
McKinsey. Top M&A trends.https://www.mckinsey.com/capabilities/m-and-a/our-insights/top-m-and-a-trends
Dealroom. M&A Key figures and trends.https://dealroom.net/blog/m-a-statistics-key-figures-and-trends
Pitchbook. Annual PE Middle Market Report. (paid report)
Premium Perks
Since you are an Wealth Stack Subscriber, you get access to all the full length reports our research team makes every week. Interested in learning all the hard data behind the article? If so, this report is just for you.
|
Want to check the other reports? Visit our website.
