- Wealth Stack Weekly
- Posts
- The Edge Game
The Edge Game
How Proximity to Information Shapes Market Advantage
Markets like to tell a clean story. Prices move because of fundamentals. Investors react to public information. Winners simply analyze better than everyone else.
Across decades of insider trading investigations, congressional trading debates, and high profile market collapses, a different pattern appears. The decisive advantage often has less to do with brilliance and more to do with position. Who sits closest to the signal before it spreads. Who hears about the earnings miss before the call. Who sees the regulatory shift before the press release. Who notices the supply chain fracture before the market notices the consequences.
This report examines that structural edge through several lenses. Public markets, where speed allows informed traders to exit before a sell cascade begins. Private markets, where illiquidity slows reactions and sometimes protects value. Government, where proximity to policy decisions can shape entire industries before legislation becomes visible to investors. And the networks, institutions, and geographic ecosystems where information flows before it becomes consensus.
The goal is not admiration. It is understanding.
Insider trading is illegal for a reason. Markets depend on fairness and equal access to information. But studying these cases reveals something deeper about how advantage is actually built. The most powerful edge in markets is often not superior intelligence. It is proximity to information.
In other words, the game is rarely about predicting the future. It is about recognizing the signal before everyone else sees it.
The First Move: Selling Before the Signal
Markets often appear chaotic in hindsight. Prices collapse, narratives shift, and investors scramble to explain what went wrong. But beneath that apparent randomness lies a simple structural truth. The earliest moves rarely belong to the broad market. They belong to the people closest to the information.
In many insider trading cases, the edge being pursued is brutally straightforward. Timing. Not prediction. Not genius. Simply knowing something material before the public signal appears. Earnings revisions, regulatory decisions, failed clinical trials, or collapsing orders inside a supply chain. When someone gains proximity to that information before it reaches the market, the incentive becomes obvious. Exit before everyone else understands what is about to happen.
This chart captures the dynamic with unusual clarity. An informed trader sells first, quietly exiting while prices still reflect the old reality. The broader market sees nothing unusual yet. But once the signal becomes public, the system reacts rapidly. Uninformed investors begin selling, often amplifying the move through herd behavior. By the time the cascade fully develops, value has already been destroyed. The early exit was the advantage.
What makes these cases so instructive is not the illegality itself. It is the instinct they reveal. Again and again, the same pattern emerges. Traders seek proximity to information because markets reward the earliest interpretation of reality. When that information is acquired illegally, the law intervenes. But the underlying economic impulse remains constant. In markets, the first move matters.

Key takeaways from chart
The earliest actor captures the largest protection of capital
When the insider sells at t=1, prices still reflect the previous equilibrium. The market has not yet digested the coming negative information. Selling at this stage preserves value that will later disappear.The market signal arrives after the informed trade
At t=1, the insider acts.
At t=2, the signal becomes public.
This lag is the entire edge. The market reacts only once the information becomes visible.Uninformed investors react rather than anticipate
Once the signal spreads, uninformed participants face a decision. Sell or hold. In this chart, roughly 70 percent of investors join the sell cascade while 30 percent hold. The majority reaction drives the price collapse.The sell cascade accelerates price discovery
Markets do not adjust smoothly. Once negative information is recognized, selling pressure compounds quickly. Each new seller confirms the signal for the next participant.Price destruction occurs after the insider has exited
The final stage shows the structural consequence. Prices move from p1 to p2, representing a 51 percent destruction of value. The informed trader has already escaped the collapse.Information asymmetry creates the economic incentive
The motivation in insider trading cases rarely centers on extraordinary insight. The advantage is proximity to information that others do not yet possess.Timing dominates analysis
Many investors believe success comes from superior forecasting. These cases reveal something more uncomfortable. Sometimes the decisive edge is simply knowing first.Markets are sequential, not simultaneous
Information does not reach all participants at the same moment. It travels through networks, institutions, and disclosures. The order in which it arrives determines who benefits.The illegal boundary is clear, but the instinct is universal
Insider trading violates market rules because it exploits non-public information. Yet the broader lesson remains valuable. Sophisticated investors constantly attempt to move closer to the sources of insight that shape markets.Edge is often about position, not intelligence
The defining advantage is rarely intellectual brilliance. It is structural positioning. Being closer to the signal before it becomes obvious.
This pattern appears repeatedly across high-profile insider trading cases. Different industries. Different players. The same underlying objective. Move closer to information. Act before the signal spreads. Protect capital before the market adjusts.
Illiquidity Changes the Game: When Information Cannot Escape
In public markets, speed defines advantage. Information appears, trades execute instantly, and prices collapse before the broader market has time to process what happened. But private markets operate under a completely different set of constraints. Liquidity is limited. Transactions are slow. Ownership is concentrated. And that changes how information moves through the system.
When an investor in a private asset receives negative information early, the instinct is the same as in public markets. Act first. Protect capital. Exit before the market understands the signal. But here is the difference. In private markets, that exit often is not possible. Ownership structures, transfer restrictions, and limited buyer pools prevent investors from selling quickly. The illiquidity that investors accept in exchange for higher returns also prevents rapid escape when bad news appears.
This chart illustrates the structural consequence of that constraint. Even when a negative signal emerges, investors cannot simply rush for the exits. Instead, information diffuses slowly through the ownership group. Some investors sell when possible, others hold, and the asset continues operating through the cycle. Instead of a rapid collapse driven by trading activity, the asset experiences temporary impact followed by recovery as fundamentals reassert themselves.
The result is a striking contrast with public markets. The presence of illiquidity dampens the destructive feedback loops that drive sell cascades. Even when investors receive bad signals, the structure forces patience. In many cases, that patience preserves value that would otherwise be destroyed by panic-driven selling.

Key insights from chart
Private markets restrict the speed of reaction
When the insider receives information at t=1, they cannot immediately liquidate the position. Ownership restrictions and thin buyer pools create friction that slows the response.Illiquidity creates an enforced holding period
Unlike public equities, private assets typically require negotiated transactions, approvals, and buyer sourcing. These structural barriers prevent rapid exits.Information still spreads, but it does not trigger instant selling
Once the signal becomes public, uninformed investors begin evaluating the situation. However, without continuous trading, reactions unfold gradually rather than explosively.Investor responses split more evenly
The chart shows a roughly 50/50 divide between investors who attempt to sell and those who hold. The absence of immediate liquidity prevents a one-sided cascade.Operational performance continues to anchor value
Because ownership cannot instantly change hands, the underlying asset continues generating cash flow, serving customers, or producing output. This anchors valuation.Short-term price impact occurs but does not spiral
Instead of a dramatic collapse, prices move from p1 to p3 during the impact phase before stabilizing and recovering.Time replaces speed as the stabilizing force
The timeline stretches across years rather than days. Investors evaluate the signal over time rather than reacting immediately.Illiquidity protects against panic-driven price discovery
Public markets price assets continuously based on sentiment and flows. Private markets price assets episodically based on transactions and operating results.The absence of rapid exits preserves long-term value
The chart’s final stage shows recovery to p4 and p5, illustrating how value can rebound when fundamentals remain intact.Illiquidity acts as both a constraint and a protection mechanism
Investors accept illiquidity to earn a premium. But that same constraint can prevent value destruction during periods of negative information or temporary uncertainty.
The lesson here is subtle but powerful. Information advantages exist in every market. But the structure of the market determines how that information translates into price movements. In liquid markets, information can trigger rapid destruction of value. In illiquid markets, the system often absorbs shocks slowly, allowing fundamentals time to recover.
Policy Proximity: When Information Lives Inside Government
Markets move on information. Earnings reports, product launches, regulatory approvals, supply shocks. Every investor is trying to interpret these signals faster and more accurately than everyone else. But occasionally, the signal does not originate inside a company or an industry. It originates inside the government.
Congress occupies a uniquely sensitive position in the information ecosystem. Legislators are routinely briefed on regulatory changes, national security developments, industry investigations, and economic policy shifts long before those developments reach the public. Those briefings are not investment tips. They are part of governing. But they create a proximity to information that very few market participants possess.
This chart highlights an uncomfortable pattern that appears frequently in public discussions about congressional trading.
A group of lawmakers, across both political parties, reported investment returns that significantly outperformed the broader market in 2025. Some of those returns exceeded the performance of the S&P 500 by wide margins. The chart does not prove wrongdoing. But it illustrates why the issue attracts scrutiny. When individuals positioned closest to policy signals consistently outperform the market, observers begin asking whether access itself is creating an edge.
What makes this dynamic particularly important is that the advantage does not need to involve direct insider trading.
Policy timing, regulatory direction, or sector-level shifts can influence entire industries. Investors who understand those shifts early can position ahead of the broader market. In that sense, congressional trading sits at the intersection of policy knowledge and capital allocation.

Key takeaways from chart
Policy decisions shape entire sectors
Legislation and regulatory action can determine the fortunes of industries such as defense, healthcare, technology, and energy. Knowing the direction of policy early provides a powerful informational context for investment decisions.Congress sits near the source of many market-moving signals
Members receive briefings on legislation, regulatory actions, and geopolitical developments before those signals become public knowledge.Performance outliers draw scrutiny
The chart shows multiple lawmakers achieving returns between roughly 18 percent and 30 percent in 2025. These results significantly exceeded the broader market benchmark.Outperformance appears across both parties
The chart includes Republicans and Democrats. This reinforces the structural issue. The advantage stems from institutional proximity, not ideology.Policy timing can matter as much as policy substance
Even without confidential details, knowing when legislation is likely to move can influence sector positioning.Markets respond to anticipated regulatory change
Industries often reprice well before a law passes. Investors anticipating regulatory outcomes can position early.Congressional portfolios operate under different visibility rules
While trades must be disclosed under the STOCK Act, disclosures often occur weeks after transactions. That delay limits real-time transparency.Political information networks can overlap with market networks
Staff briefings, committee hearings, and industry consultations create information channels that intersect with market expectations.The issue reflects structural proximity to information
The debate around congressional trading is not purely about legality. It is about whether institutional access creates an unfair informational advantage.The broader lesson extends beyond politics
The chart illustrates a universal principle in markets. Investors constantly attempt to move closer to the sources of information that shape outcomes.
This dynamic appears repeatedly in discussions about information advantage. Whether the signal originates inside a corporation, a supply chain, or a government briefing room, the instinct is the same. Move closer to the source of the signal. Interpret it before the broader market does. And position capital accordingly.
The Bipartisan Edge: Information Advantage Does Not Vote
When discussions about congressional trading emerge, the conversation often drifts into partisan territory. One party accuses the other. Individual names dominate headlines. Political narratives take over. But when you step back and look at the data structurally, a different pattern appears. The advantage, if it exists, does not belong to a party. It belongs to position.
This chart compresses the observation into a simple comparison. Lawmakers from both major parties who outperformed the S&P 500 in 2025 produced remarkably similar average returns. Republicans averaged roughly 43 percent. Democrats averaged about 39 percent. The difference between them is minimal compared with the distance between both groups and the broader market.
That symmetry reveals something important about how information advantages actually work. Markets do not care about ideology. They care about access. Anyone operating near the center of policy formation sits closer to signals that can influence entire industries. Regulatory shifts, committee investigations, fiscal policy changes, or geopolitical developments often shape capital flows long before those signals become widely understood by investors.
Seen through that lens, the chart becomes less about politics and more about institutional structure. The edge appears where information originates. In this case, proximity to policy appears to correlate with investment outcomes that exceed the broader market.

What This Chart Reveals About Structural Information Advantage
Outperformance appears across the entire political spectrum
Both parties show substantial average returns among members who beat the S&P 500. The pattern suggests that proximity to policy information, not party ideology, is the common factor.The magnitude of returns is notable
Average returns near 40 percent dramatically exceed typical market benchmarks in most years. Results of this scale naturally draw scrutiny from investors and regulators.Institutional access is the shared variable
Members of Congress participate in briefings, committee sessions, regulatory discussions, and industry consultations. These environments expose them to policy signals before they become public narratives.Policy shifts ripple through markets before legislation is finalized
Markets often reprice industries when policy direction becomes clear, not when laws are formally passed.Timing matters as much as the policy itself
Knowing when regulatory momentum is building can influence investment decisions well before a final vote occurs.The informational ecosystem surrounding government is dense
Lobbyists, regulators, industry leaders, and policy analysts interact constantly with lawmakers. These networks create a flow of insight unavailable to most investors.Disclosure rules create delayed transparency
Trades by members of Congress are typically disclosed after they occur, sometimes weeks later. This delay makes it difficult for outside observers to evaluate decisions in real time.The issue is structural, not partisan
Because both parties appear in the data, the conversation shifts away from political blame and toward institutional design.Access to policy signals is a form of proximity to information
Just as corporate insiders sit near earnings data, policymakers sit near regulatory information that can shape market outcomes.The broader market lesson remains consistent
Across every insider trading case, whether corporate or political, the same instinct appears. Investors attempt to move closer to the signals that will eventually move prices.
This chart reinforces a recurring theme across insider trading investigations and debates. Markets reward proximity to information. When that proximity exists inside institutions with policy influence, the line between governance and market advantage becomes a subject of intense public scrutiny.
Geography of Advantage: Where Information and Networks Intersect
When most people think about insider advantage, they imagine individuals. A trader. A CEO. A policymaker. But information advantages rarely operate at the individual level alone. They exist inside networks. Political networks, regulatory networks, industry networks, and capital networks that intersect around people in positions of influence.
This chart shifts the lens from individuals to geography. Instead of focusing on specific lawmakers, it aggregates the average returns of congressional traders who outperformed the S&P 500 in 2025 by the state they represent. The range of outcomes is striking. Some states show average returns exceeding 70 percent. Others sit closer to 30 percent. Even the lowest performers in this group still materially exceeded the market.
At first glance, the variation might look random. But geography often reflects deeper structural factors. Certain states concentrate specific industries. Others host powerful committee members or legislators deeply embedded in regulatory oversight. Some sit closer to major financial networks or defense contracting hubs. In other words, geography can act as a proxy for proximity to information ecosystems.
Seen through that lens, the chart becomes less about where lawmakers live and more about the networks they inhabit. Policy influence, committee assignments, and industry relationships create information flows that intersect with capital markets. The closer an investor sits to those flows, the earlier they may see signals that eventually shape prices.

Key takeaways from chart
Information advantages often travel through networks, not individuals
Legislators operate within webs of relationships that include regulators, industry leaders, lobbyists, and policy advisors.Geography can reflect industry concentration
States with large defense sectors, healthcare clusters, or energy industries often generate more regulatory interaction.Committee assignments influence information access
Members serving on committees related to finance, technology, defense, or healthcare frequently receive earlier insight into policy direction affecting those sectors.Policy signals often originate regionally before becoming national
Local industries interact with lawmakers regularly, providing feedback that shapes legislation and regulatory priorities.Returns exceeding 60 percent indicate significant outperformance
Several states show average returns well above typical annual market performance, highlighting the scale of the divergence.Variation across states suggests uneven information ecosystems
Some lawmakers sit closer to industry and policy crossroads than others, influencing the flow of insight they encounter.Political influence and economic influence often overlap geographically
Regions that host major corporate headquarters, regulatory bodies, or contracting networks tend to produce denser information environments.The advantage does not require illegal behavior to exist
Simply being embedded in policy and industry discussions can provide earlier context about where regulation or spending may move.Market participants constantly attempt to access these networks
Lobbyists, consultants, and institutional investors invest heavily in understanding the policy environments shaping industries.Proximity to information remains the common thread
Whether through corporate leadership, government oversight, or industry networks, the investors closest to emerging signals often act first.
Across insider trading cases, the pattern repeats. The edge rarely comes from superior intelligence alone. It comes from structural positioning. Being closer to the conversations, the decisions, and the signals that eventually move markets.
The Proximity Premium: When Access Outperforms the Market
Every insider trading case ultimately revolves around the same question. Where did the edge come from. Was it superior analysis. Better models. Extraordinary foresight. Or was it something much simpler. Proximity to information before the market fully understands it.
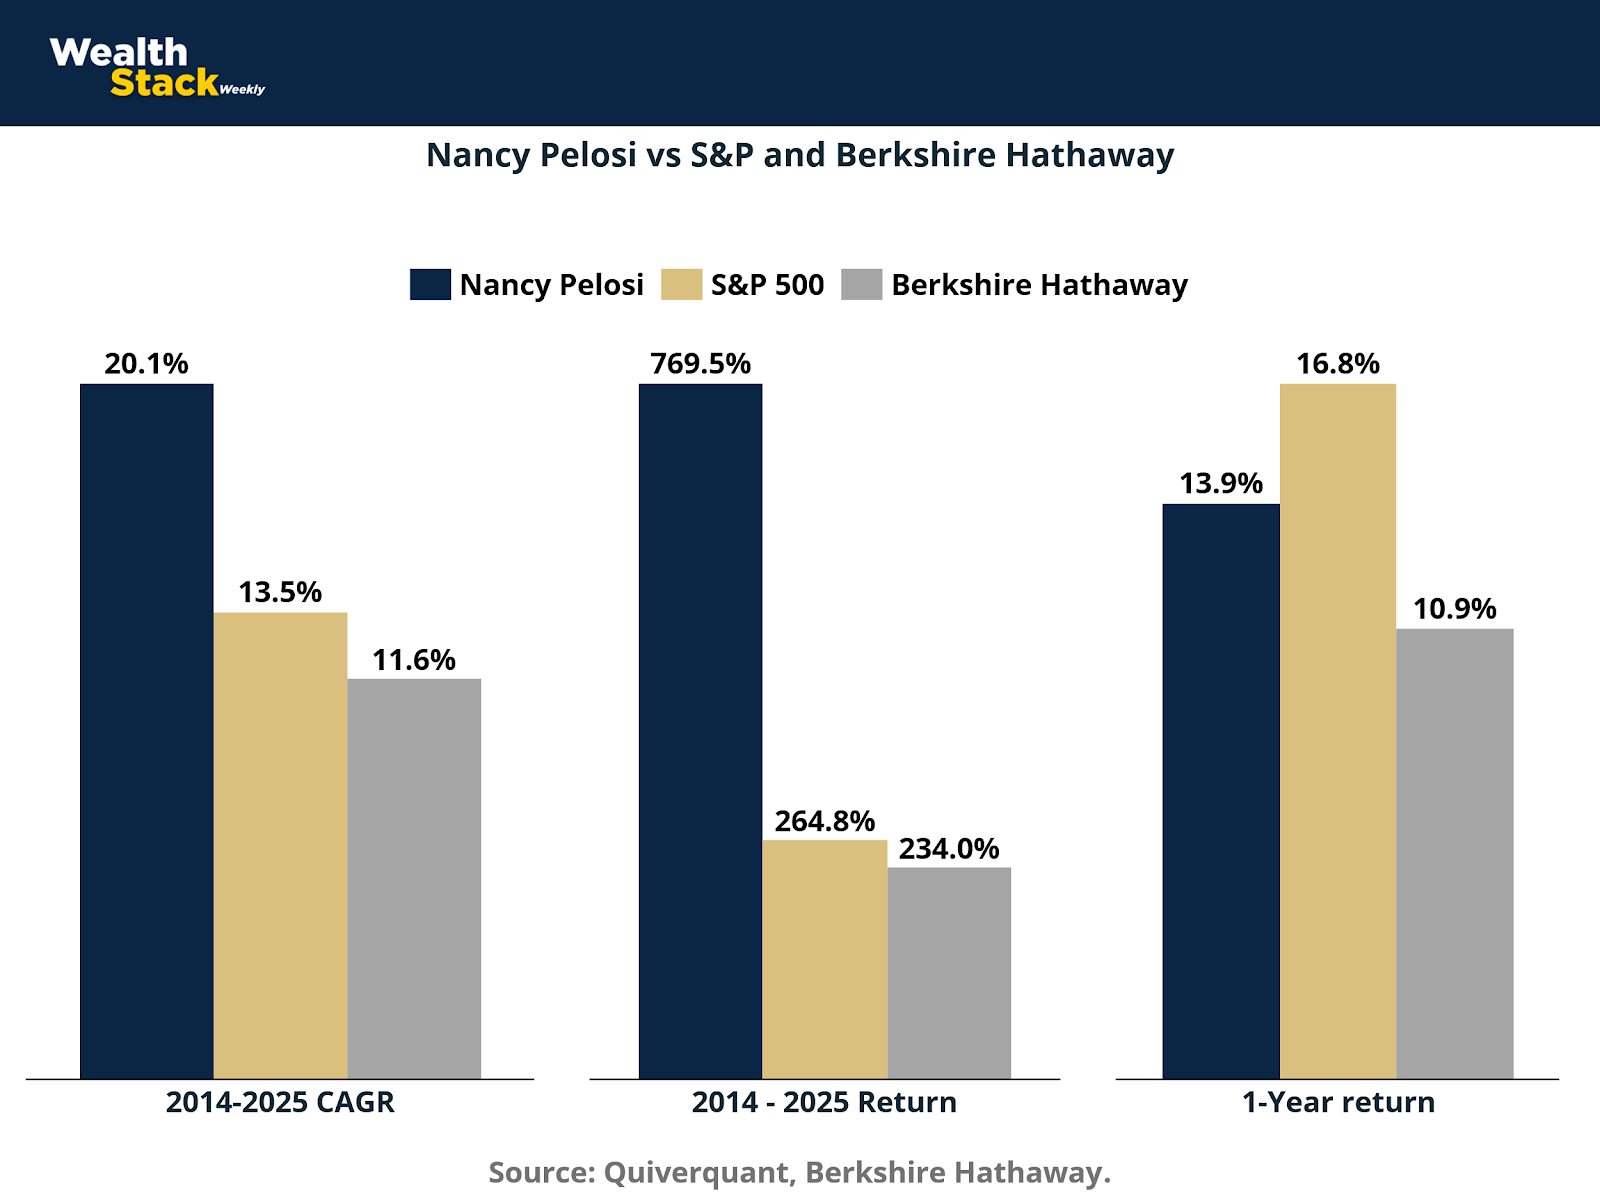
This chart illustrates that question through a specific example that has become a recurring point of public debate. Over the past decade, the investment portfolio associated with Nancy Pelosi’s household has dramatically outperformed major benchmarks. The comparison here places those results beside two reference points investors widely respect. The S&P 500 and Berkshire Hathaway. One represents the broad U.S. equity market. The other represents one of the most disciplined long term capital allocators in modern history.
The difference is striking. Over the 2014 to 2025 period, the Pelosi portfolio shows returns that significantly exceed both benchmarks. The annualized growth rate stands well above the S&P. The total return over the period dwarfs even Berkshire Hathaway’s performance. Yet in the most recent one year window the pattern flips. The market outperforms.
This volatility tells us something important. Extraordinary returns do not necessarily imply extraordinary forecasting ability. Instead they often reflect periods where investors sit closer to information flows shaping specific sectors. Policy debates around semiconductors, technology regulation, healthcare reimbursement, and defense spending have repeatedly intersected with the types of industries represented in congressional portfolios. The edge, when it exists, is rarely about predicting the future. It is about understanding signals before they become consensus.
Key insights from chart
Long term outperformance can compound dramatically
A CAGR near 20 percent over more than a decade produces total returns approaching 770 percent. Compounding magnifies even modest informational advantages over time.Benchmark comparison reveals the scale of divergence
The Pelosi portfolio outperformed both the S&P 500 and Berkshire Hathaway across the full period from 2014 to 2025.The comparison matters because Berkshire represents elite capital allocation
Berkshire Hathaway’s long term strategy is widely regarded as one of the most disciplined in modern investing. Outperforming that benchmark attracts attention.Short term performance still fluctuates
In the one year comparison the S&P 500 actually exceeds the Pelosi portfolio. This highlights the uneven nature of investment outcomes even when long term results appear strong.Sector exposure often overlaps with policy focus
Congress frequently debates legislation affecting technology, defense, healthcare, and energy. These sectors regularly appear in congressional portfolios.Policy visibility can provide early context
Knowing where regulatory pressure or federal spending is likely to move may help investors position ahead of broader market awareness.Large cumulative returns rarely come from a single trade
They emerge from repeated positioning across multiple cycles where the investor recognizes signals earlier than the broader market.The debate centers on proximity to information
Critics argue that lawmakers operate too close to policy signals that influence markets. Defenders argue that the trades reflect normal portfolio management.The broader lesson transcends any individual
The purpose of examining these cases is not to single out one investor. It is to understand how information advantages function in real markets.The instinct remains constant across all insider cases
Whether the signal comes from corporate earnings, regulatory policy, supply chain disruptions, or government briefings, investors repeatedly attempt to move closer to the source of information.
That instinct is the common thread running through every insider trading investigation and every debate about market fairness. The edge is rarely mystical. It is structural. The closer an investor sits to the signal before it becomes public, the greater the advantage when markets eventually adjust.
Sources & References
Quiverquant. Nancy Pelosi Strategies. https://www.quiverquant.com/strategies/s/Nancy%20Pelosi/
Independent. Congress Beat Stock Market. https://www.independent.org/article/2026/02/16/congress-beat-stock-market-2025/
Forbes. Congress Million Dollar Stock Trades. https://www.forbes.com/sites/zacheverson/2025/12/24/congress-million-dollar-stock-trades-2025/
Fool. Congressional Stock Trading. https://www.fool.com/research/congressional-stock-trading-who-trades-and-makes-the-most/
Finance Yahoo. Nancy Pelosi beats the market. https://finance.yahoo.com/news/nancy-pelosi-beat-market-581-162100416.html
Berkshire Hathaway. Company returns. https://berkshirehathaway.com/2025ar/2025ar.pdf
Premium Perks
Since you are an Wealth Stack Subscriber, you get access to all the full length reports our research team makes every week. Interested in learning all the hard data behind the article? If so, this report is just for you.
|

Want to check the other reports? Visit our website.