- Wealth Stack Weekly
- Posts
- The Hidden Costs of Human Nature in Investing
The Hidden Costs of Human Nature in Investing
Investing is often framed as a purely rational pursuit — a matter of crunching numbers, assessing probabilities, and optimizing for return.

Yet decades of behavioral finance research reveal a far more complicated truth: markets are shaped as much by human psychology as by financial fundamentals. From overconfidence and poor timing to loss aversion and individual temperament, the way people behave around money often diverges sharply from what traditional theory predicts. These behavioral tendencies do not just explain short-term mistakes; they shape long-term wealth outcomes, dictating who participates, who prospers, and who falls behind.
This report brings together several of the most compelling insights from the field, weaving together seminal academic findings, real-world data, and psychological patterns that define the investor experience. We examine how overconfidence drives excessive trading and erodes returns, why losses weigh more heavily than gains, and how investor behavior gaps cost even disciplined savers meaningful performance.
We also go beyond first-order explanations, exploring the second-order insight that different psychological archetypes — adrenaline seekers, steadiness seekers, and expertise leaners — lead to very different wealth-building journeys. Finally, we zoom out to consider who actually participates in markets, highlighting the structural and psychological divides that determine access to one of the most powerful engines of wealth creation.
Overconfidence and the Cost of Excessive Trading
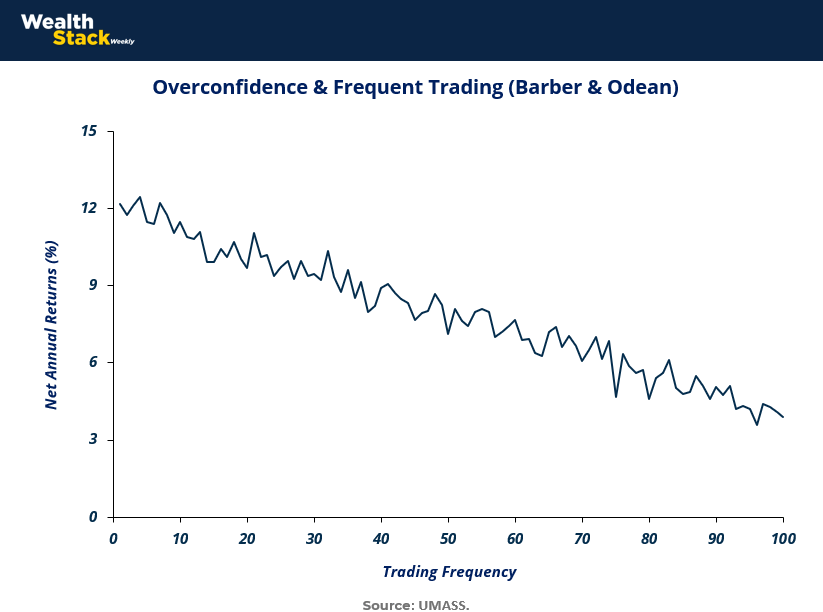
The illusion of control is one of the most powerful traps in investing. Many investors believe that by actively trading, constantly adjusting their portfolios, or trying to outguess the market, they can generate superior returns. Yet, evidence consistently proves otherwise. Barber & Odean’s seminal 2001 study demonstrated that frequent traders systematically underperform less active investors, primarily because their confidence in identifying winning trades exceeds their actual ability.
This overconfidence not only drives up transaction costs but also results in poorly timed entries and exits, eroding long-term performance. What feels like control is, in fact, a self-imposed handicap.
The chart below captures this dynamic vividly: as trading frequency rises, net annual returns steadily decline. Investors who trade occasionally maintain returns closer to double digits, while those who trade most often see their performance sink dramatically.
The finding is more than a historical quirk — it is a psychological insight. Overconfidence leads to excessive activity, which in turn leads to wealth destruction. For both retail investors and professionals, the lesson is sobering: doing less often achieves more in markets.

Key Insights and Analysis
Core Finding: Barber & Odean (2001) showed that overconfident investors trade too frequently, reducing their net annual returns compared to more patient peers.
Mechanism of Underperformance:
High trading frequency increases transaction costs (commissions, bid–ask spreads, taxes).
Overconfident investors tend to time trades poorly, chasing past winners and selling out of future winners too early.
Gender Differences: The original study highlighted that men traded more frequently than women and underperformed by a larger margin, attributing this gap partly to higher overconfidence among men.
Broader Implication: Overconfidence is not limited to retail investors — fund managers and institutional investors are not immune. Behavioral biases can distort decisions even at the professional level.
Practical Lesson: A disciplined, lower-activity strategy often outperforms in the long run. Adopting rules (like limiting trade frequency, sticking to asset allocation, or using passive vehicles) helps guard against the costly effects of overconfidence.
Relevance Today: With zero-commission trading apps and gamified platforms, overconfidence-fueled trading is more accessible — and more dangerous — than ever. The lessons of Barber & Odean are perhaps even more urgent now than in 2001.
Prospect Theory: Why Losses Loom Larger than Gains
Traditional finance theory assumes that investors are rational, weighing risk and reward in a symmetrical fashion. But reality is far more complex. Kahneman and Tversky’s groundbreaking Prospect Theory shattered the myth of rational decision-making, showing that people evaluate outcomes relative to a reference point rather than in absolute terms.
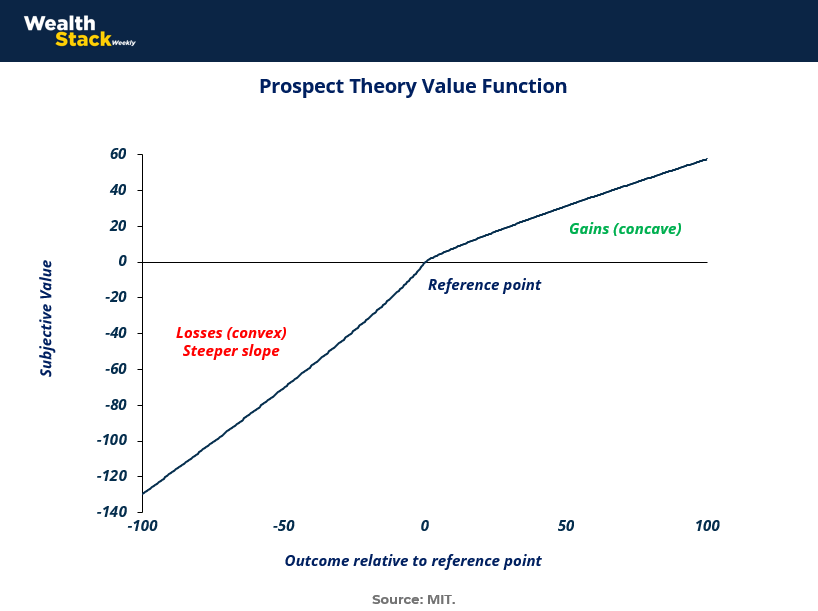
Most importantly, the pain of losses is felt far more intensely than the joy of equivalent gains. A $100 loss hurts about twice as much as a $100 gain feels good, creating a psychological asymmetry that shapes nearly every financial decision.
The chart below illustrates this core idea. The curve is concave in the gains domain, reflecting diminishing sensitivity — each incremental gain feels smaller than the last. Conversely, it is convex and steeper in the losses domain, demonstrating how losses cut deeper and dominate decision-making.
This framework explains why investors often refuse to sell losing positions (the “disposition effect”), why they chase risk after setbacks, and why they prefer sure small gains over uncertain larger ones. In short, Prospect Theory reveals the human side of markets: emotions tilt the scales more than pure math ever could.

Key takeaways from chart
Reference Point Dependence: Investors evaluate outcomes relative to a psychological baseline, not in absolute terms. A gain only feels good compared to where you started.
Loss Aversion: Losses have roughly 2x the emotional impact of equivalent gains. This “asymmetry” drives many puzzling behaviors in investing and everyday choices.
Concavity in Gains: The subjective value of each additional dollar earned decreases. Winning $100 feels great, but winning $200 does not feel twice as good.
Convexity in Losses: The pain of losses also flattens at extreme levels — losing $1,000 hurts much more than losing $100, but losing $10,000 doesn’t feel 100x worse.
Behavioral Implications for Investors:
Holding onto losing stocks too long in hopes of a rebound (disposition effect).
Selling winners too quickly to “lock in” gains.
Taking excessive risks after losses, hoping to break even (risk-seeking in losses).
Practical Relevance: Understanding loss aversion helps explain why investors underperform even in rising markets, why insurance products sell so effectively, and why financial advisors must manage not just portfolios but client psychology.
Broader Lesson: Markets are not just mechanisms of price discovery but also mirrors of human psychology. Recognizing loss aversion is the first step toward building strategies that protect investors from themselves.
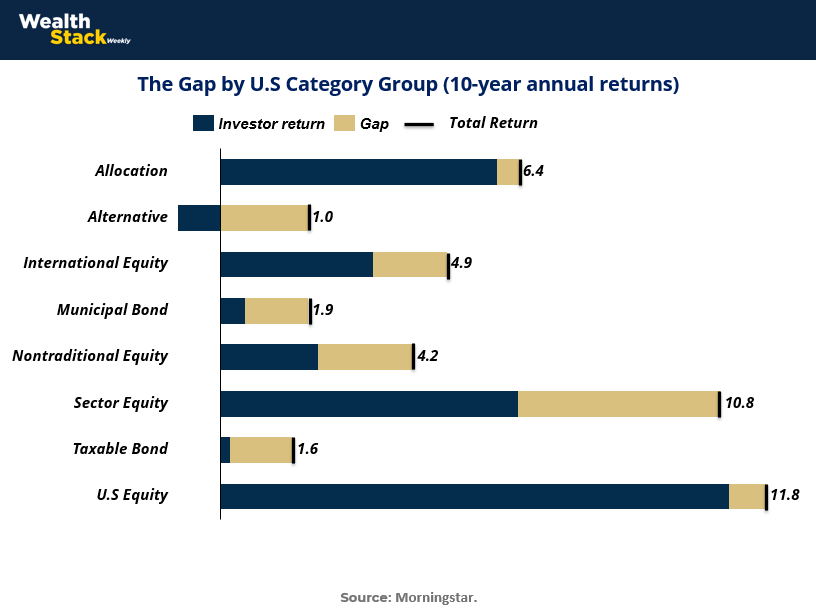
Even when investors select strong funds, their realized returns often fall short of the funds’ published results. Morningstar’s Mind the Gap study quantifies this gap by comparing the total returns of funds with the actual dollar-weighted returns investors earn, accounting for the timing of their contributions and withdrawals. The finding is consistent: investor behavior shaves off a significant portion of returns, usually around 1–2 percentage points annually.
This penalty stems from a tendency to buy high after periods of strong performance and sell low during downturns — a behavioral loop that steadily eats away at wealth.
The chart below shows how the gap manifests across major asset categories. In U.S. equity, for example, funds generated average annual returns of 11.8% over a 10-year horizon, but investors captured less due to poor timing decisions.
The gap is visible across equities, bonds, and alternatives, though the magnitude differs. For sector equity funds, the gap was especially wide, as investors chased hot themes and abandoned them during downturns. This evidence underscores a sobering truth: investment success is not only about what you own, but when and how you hold it.

Key insights from chart
Behavior vs. Product:
Funds often perform well on paper, but investors underperform the very products they hold.
The average “behavior gap” is about 1.7% annually according to Morningstar’s 2022 report.
Category Differences:
U.S. Equity: Strong long-term returns (11.8%) but investors still lagged due to poorly timed buying/selling.
Sector Equity: The gap is especially large, reflecting trend-chasing behavior.
Bonds (Municipal and Taxable): Smaller absolute gaps, but even modest timing errors eroded low single-digit returns significantly.
Alternatives: Gap smaller in absolute terms, but still meaningful relative to total return.
Underlying Drivers of the Gap:
Performance chasing: Buying funds after rallies, selling after declines.
Market timing attempts: Overconfidence in predicting short-term moves.
Liquidity needs: Investors withdrawing during stress, locking in losses.
Practical Takeaway:
Automating contributions and sticking to systematic strategies helps neutralize the gap.
Advisors play a crucial role in coaching investors to resist emotional reactions to short-term performance.
Broader Implication: The real battle for returns is not always with the market — it’s with one’s own psychology. Avoiding the gap can be more powerful than chasing the next hot fund.
Second-Order Insight: Investor Psychology and Wealth-Building Patterns
The most powerful insights in behavioral finance do not just explain why investors underperform in aggregate — they also illuminate why individuals take very different paths toward wealth. Beneath the surface of returns and allocations lies psychology: deep-seated tendencies that push each person toward certain patterns of behavior. Some investors are drawn to the thrill of risk, chasing opportunities with an almost adrenaline-like impulse.
Others crave steadiness, favoring long-term stability over short-term excitement. Still others lean heavily on expertise, applying specialized knowledge or analysis to carve out a unique investment edge. These preferences are not merely stylistic quirks; they shape outcomes and determine whether wealth compounds, stalls, or erodes.
Unlike the universal findings of Prospect Theory or the investor return gap, these second-order patterns remind us that investing is also profoundly individual. The same market environment can produce radically different behaviors depending on temperament. One investor’s excitement about a volatile growth stock is another’s red flag to stay away. Similarly, while some take comfort in steady, rules-based index investing, others find fulfillment in carefully chosen niche allocations that match their expertise.
Recognizing these psychological archetypes matters not only for self-awareness but also for portfolio design, risk management, and long-term financial planning. In a world where investors often compare themselves to others, the real key is aligning strategies with one’s own psychological wiring.
Key insights driving this
Three Core Behavioral Archetypes:
Adrenaline Seekers: Motivated by excitement, tend to trade more, chase trends, and may face higher risks of underperformance.
Steadiness Seekers: Prefer consistency, often gravitate toward passive investing, fixed income, or long-term strategies; more likely to capture compounding benefits.
Expertise Leaners: Use specialized knowledge (industry experience, deep research, or technical skill) to create conviction-based portfolios; results can vary widely depending on skill level.
Psychological Roots:
Reflect differences in risk tolerance, sensation-seeking, and control orientation.
These tendencies often emerge from personality traits as much as from financial literacy.
Impact on Wealth Outcomes:
Adrenaline-driven investors may overtrade, replicating Barber & Odean’s findings.
Steady investors are less prone to the “behavior gap” measured by Dalbar and Morningstar.
Expertise-driven investors can outperform if their edge is real, but risk overconfidence if it is not.
Advisor/Investor Implications:
Financial advisors must tailor strategies to personality — not just market data.
Aligning portfolios with behavioral tendencies reduces stress and increases adherence over time.
Broader Lesson: Wealth-building is not one-size-fits-all. Recognizing your psychological profile — and its strengths and vulnerabilities — is essential for long-term success.
Who Owns Stocks? The Uneven Landscape of Market Participation
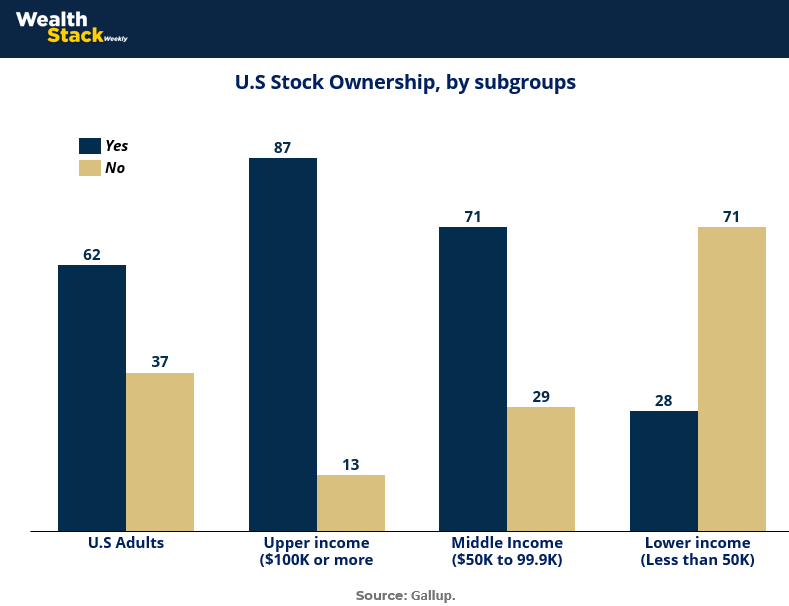
While markets are often portrayed as democratic wealth-building machines, stock ownership in the U.S. remains highly uneven. Gallup’s latest survey shows that about 62% of U.S. adults own stocks, either directly or through vehicles like mutual funds and retirement accounts. But that overall figure masks stark differences by income. Stock ownership is almost universal among upper-income households, with 87% participation for families earning $100,000 or more. In contrast, only 28% of households earning less than $50,000 hold any equities at all. The disparity reveals how access to capital markets — and the compounding benefits they provide — is far from evenly distributed.
This divide underscores a key challenge in financial inclusion: those who most need the long-term wealth-building power of equities are often the least able to access it. Lower-income households face barriers ranging from lack of disposable income to limited financial literacy and higher risk aversion. Meanwhile, higher-income households not only participate at much higher rates but also tend to allocate larger dollar amounts, magnifying the wealth gap over time. The chart below illustrates this divide clearly, showing how income stratification maps directly onto stock ownership.

Key takeaways from chart
Overall Participation: Roughly 6 in 10 Americans (62%) own stocks in some form, showing that equity participation is significant but not universal.
Income Stratification:
Upper Income ($100k+): 87% own stocks — equity ownership is nearly universal at higher income levels.
Middle Income ($50k–$99.9k): 71% own stocks — participation is strong but not guaranteed.
Lower Income (<$50k): Only 28% own stocks — the majority are excluded from equity markets.
Wealth Gap Implications:
Stock market participation is one of the primary engines of wealth accumulation in the U.S.
Lower participation among low-income households compounds inequality over time.
Indirect Ownership vs. Direct: Gallup counts ownership via 401(k)s, IRAs, and mutual funds, not just direct holdings — without retirement plans, the participation rate would likely be even lower.
Behavioral Considerations:
Risk aversion is higher among lower-income households, amplifying reluctance to invest.
Limited resources mean a higher share of income goes to necessities, leaving little left for long-term investing.
Policy and Practical Relevance:
Expanding access through employer retirement plans, auto-enrollment, and financial education could help narrow the gap.
Advisors and policymakers must recognize that investment participation is not just about choice, but about structural opportunity.
Conclusion
The evidence is clear: investment outcomes are not just a product of markets, but of minds. Overconfidence can turn activity into a liability, loss aversion can paralyze rational decision-making, and poor timing can transform solid investments into disappointing results. Even when the tools of wealth-building are available, human tendencies often conspire to hold investors back. Yet within these challenges lie opportunities. By understanding the psychological biases that drive behavior, investors can design systems, habits, and guardrails to protect themselves from themselves.
Perhaps most importantly, recognizing the diversity of investor psychology reframes success. There is no one-size-fits-all approach to building wealth. Some thrive in steadiness, others in expertise, and some must learn to temper their appetite for risk. Meanwhile, structural disparities in stock ownership remind us that access itself is uneven — and that financial inclusion must be part of the conversation. Ultimately, the path to better outcomes lies in aligning strategies not just with markets, but with the human realities of how we perceive risk, reward, and opportunity. In that alignment, psychology becomes not a hurdle to overcome, but a tool to harness.
Sources & References
Morningstar. Mind the Gaphttps://www.morningstar.com/funds/bad-timing-cost-investors-one-fifth-their-funds-returns
UMASS.Barber & Odean. https://www.umass.edu/preferen/You%20Must%20Read%20This/Barber-Odean%202011.pdf
Gallup. % Americans that own stocks.https://news.gallup.com/poll/266807/percentage-americans-owns-stock.aspx
Premium Perks
Since you are an Wealth Stack Subscriber, you get access to all the full length reports our research team makes every week. Interested in learning all the hard data behind the article? If so, this report is just for you.
|
Want to check the other reports? Visit our website.
