
Macroeconomic Environment and Fiscal Outlook
1. A Decade Defined by Instability
The U.S. economy has entered a period marked by persistent uncertainty, characterized by post-pandemic structural disruptions, elevated inflation, aggressive monetary tightening, and renewed fiscal concerns. The sharp contraction in GDP during early 2020 and the subsequent unprecedented rebound underscore the instability that continues to shape investor expectations and policymaking. While growth has returned to positive territory, the trajectory remains uneven and below historical trend.
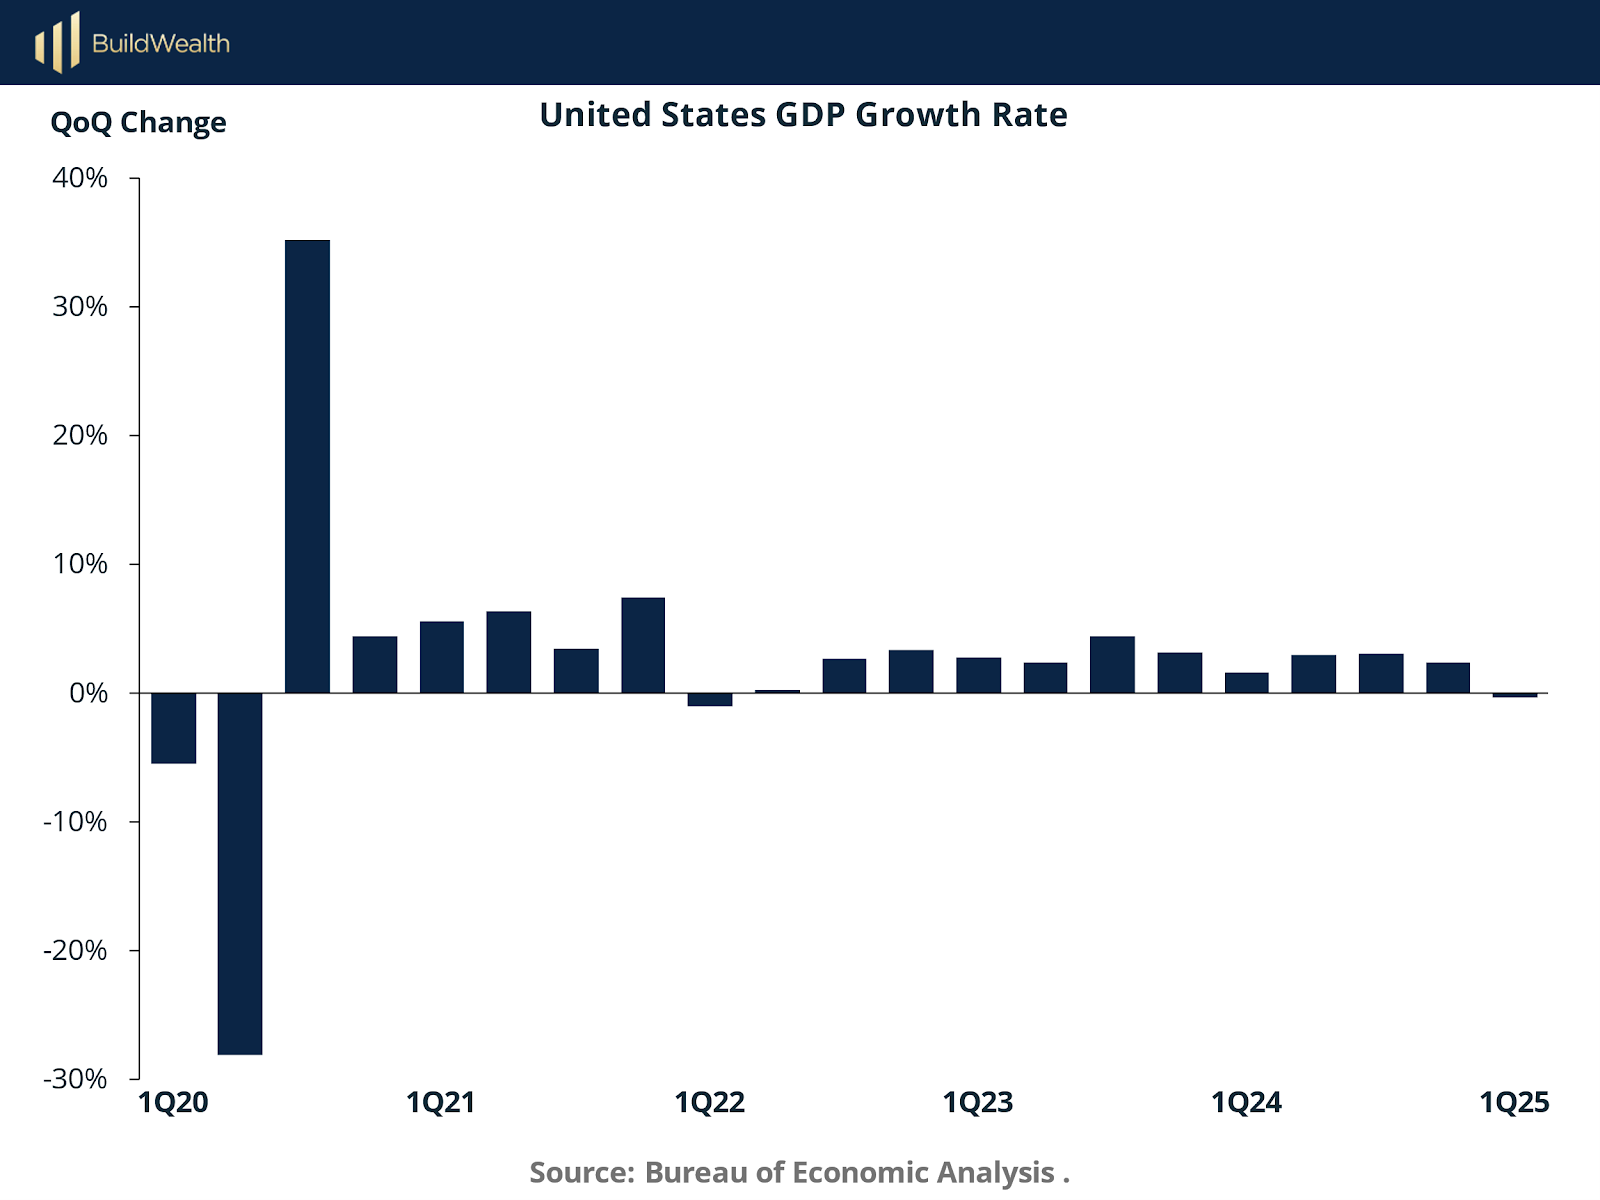
This chart illustrates the dramatic contraction and rebound in U.S. GDP around 2020, followed by a reversion to modest and volatile growth.
From 1Q21 onward, GDP growth has struggled to find consistency. While there have been quarters of strength, the underlying trend reflects slowing momentum amid tightening financial conditions, waning fiscal stimulus, and global macro headwinds. The recent quarters show stagnating growth—hovering close to zero in early 2025—raising concerns over a potential soft landing or mild recession.
2. Inflation Pressures and Monetary Policy Response
The pandemic-era stimulus and global supply chain bottlenecks fueled one of the sharpest inflationary surges in decades. The U.S. Consumer Price Index peaked at nearly 9% YoY in mid-2022, triggering an aggressive policy response from the Federal Reserve. Although headline inflation has since cooled, core inflation (excluding food and energy) remains elevated and sticky, hovering above the Fed’s 2% target.

This chart compares headline and core inflation trends, highlighting the persistence of price pressures despite declining energy costs.
3. Interest Rates and Policy Volatility
In response to inflationary concerns, the Federal Reserve implemented the most rapid hiking cycle in over four decades, raising the Federal Funds Rate from near-zero to over 5% in under two years. While market yields on 10-year Treasury securities have followed, they remain below historical peaks, reflecting investor skepticism over long-term growth and inflation sustainability.
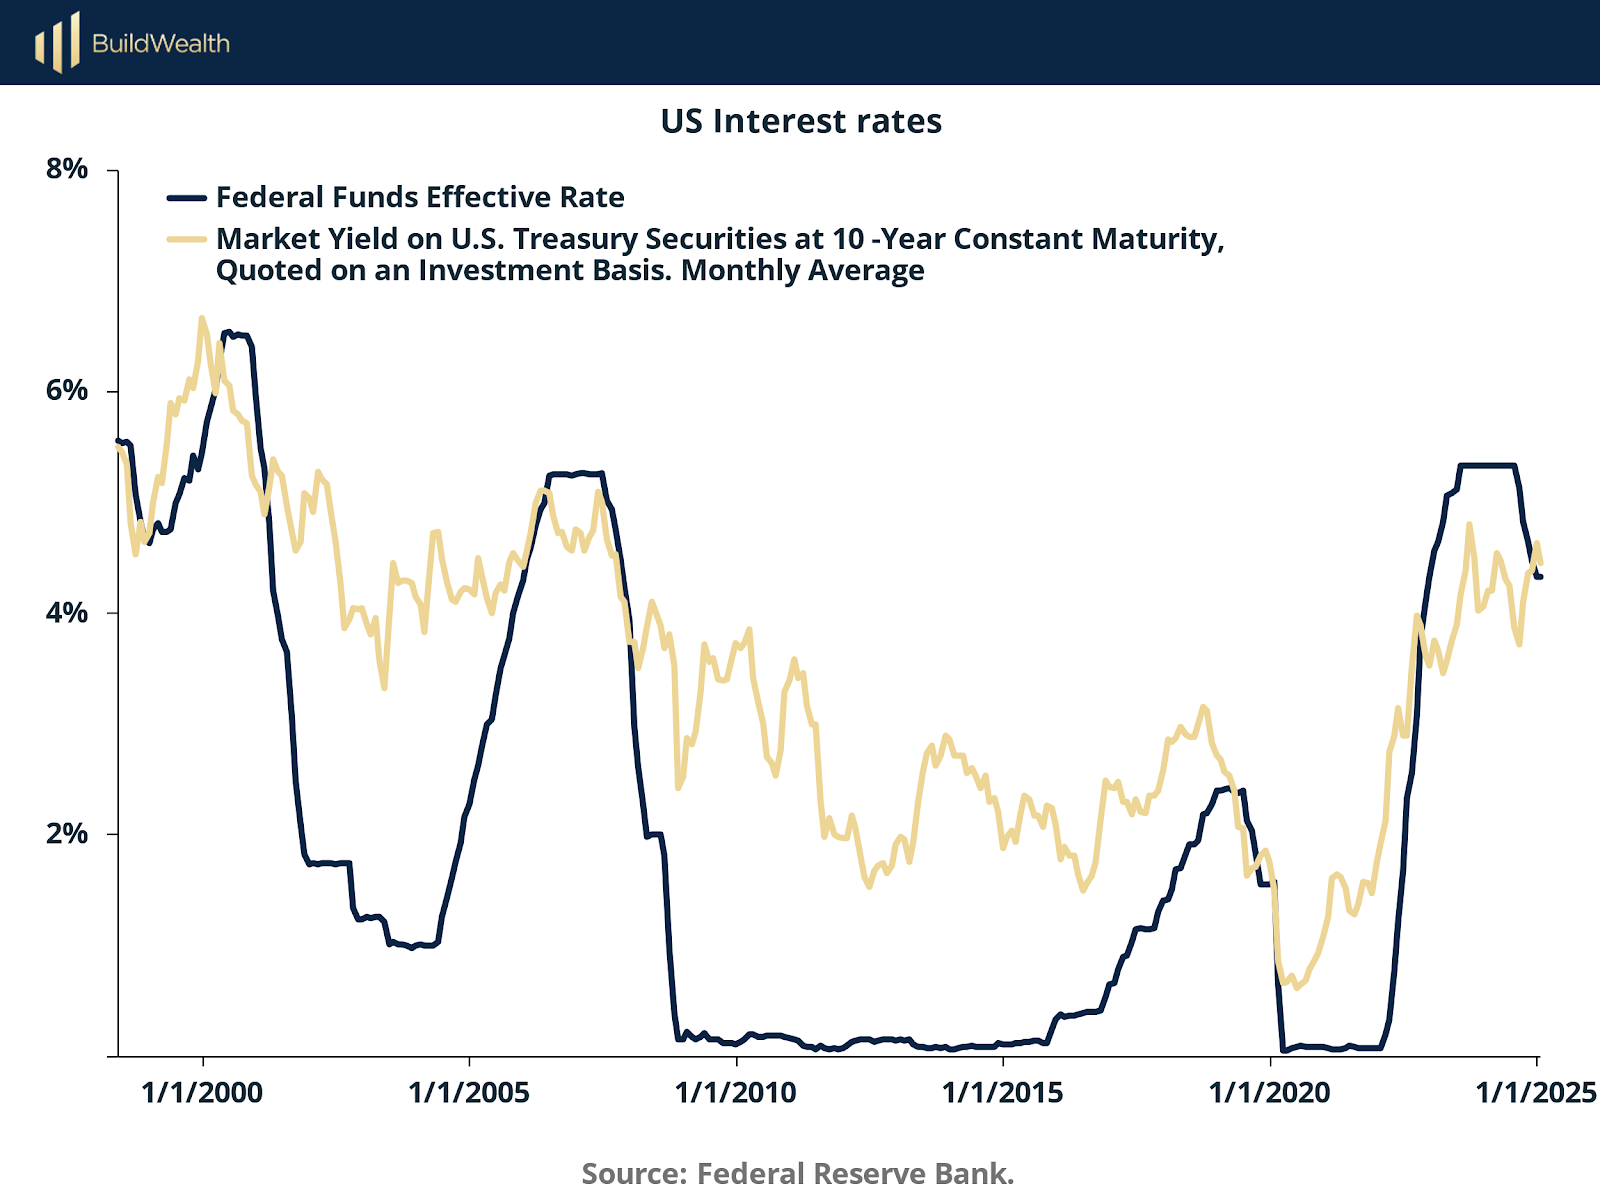
This chart displays the sharp divergence between short- and long-term rates, signaling policy-driven dislocations and yield curve inversion risk.
The inversion of the yield curve—a common precursor to recession—has persisted, raising alarms about the economic outlook. Elevated rate volatility has also transmitted into equity and credit markets, contributing to increased risk premiums and dampened investor appetite for long-duration assets.
How Does Volatility Look in Public Markets? An example with the Phenomenon of Sudden Stops
One of the clearest illustrations of how public markets respond to elevated uncertainty is the sudden stop phenomenon observed in emerging market capital flows. When macroeconomic or geopolitical shocks occur, capital tends to exit liquid, publicly traded assets rapidly—often indiscriminately—regardless of underlying fundamentals.
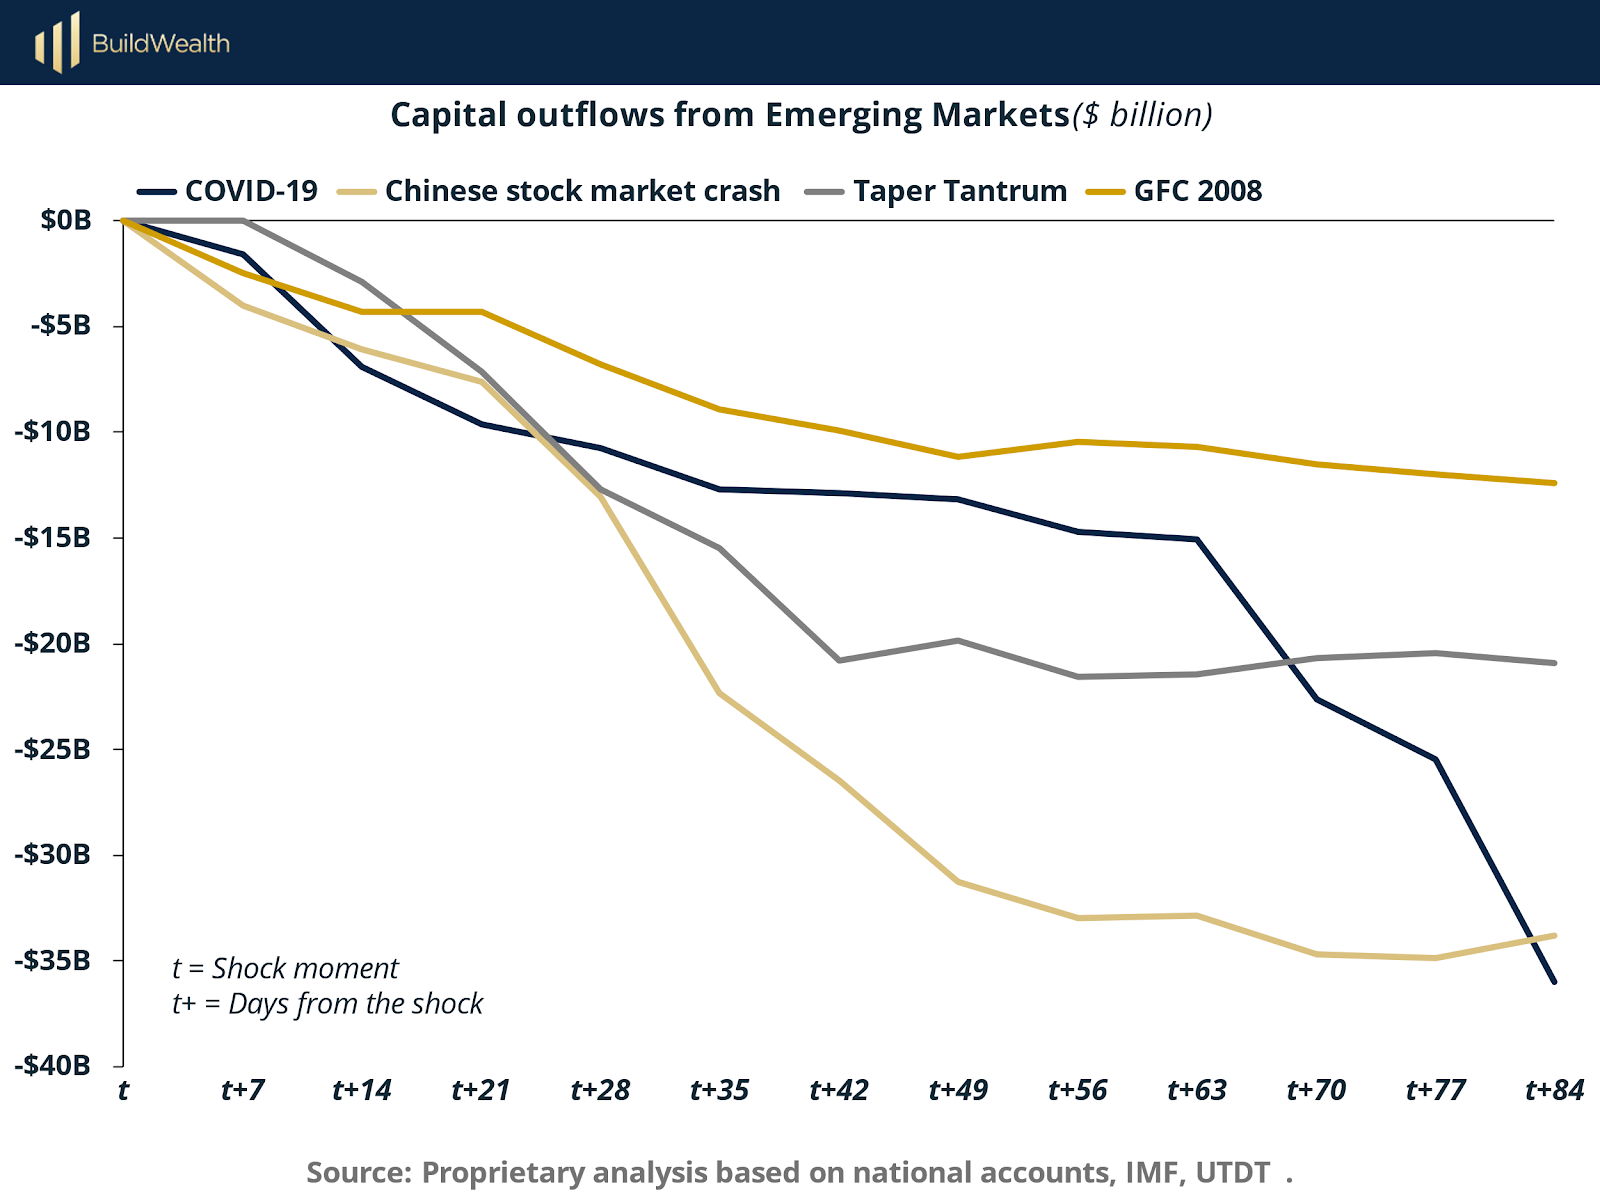
The chart compares four major volatility events: the Global Financial Crisis (2008), the Taper Tantrum (2013), the Chinese Stock Market Crash (2015), and the COVID-19 shock (2020). In each case, capital outflows from emerging markets accelerated within days of the shock, with cumulative losses often exceeding $30–$35 billion in under three months.
The most aggressive outflows occurred during the COVID-19 crisis, underscoring how a global health event, when paired with economic paralysis and policy uncertainty, can overwhelm investor risk models and trigger systemic de-risking. Importantly, these outflows were concentrated in publicly traded instruments—sovereign debt, equities, and ETFs—while private capital flows remained relatively stable, due to longer lock-up periods and lower mark-to-market sensitivity.
These episodes demonstrate how liquidity and transparency, though beneficial in normal conditions, can become liabilities during turbulent periods. Public markets act as shock absorbers, but they do so at the expense of significant short-term wealth destruction. Capital exits swiftly, volatility spikes, and asset correlations rise, amplifying the impact of uncertainty.
In contrast, private markets are structurally insulated from these sudden reversals, offering a form of passive stability. Investors with longer investment horizons and locked-in capital structures are better positioned to ride out volatility, rather than being forced to exit during drawdowns.
Comparing Public vs. Private Markets: Volatility, Sensitivity, and Wealth Preservation
1. How Public and Private Markets React to Interest Rates
The transmission of interest rate changes to market valuations is a defining feature of financial volatility. This section compares the sensitivity of public equity indices and U.S. private equity middle-market deal values to long-term interest rates, using ordinary least squares (OLS) regressions on logarithmic transformations of both variables. Specifically, we examine how the log of the 10-year U.S. Treasury yield impacts the log of NASDAQ Composite returns and log of PE middle-market deal values.
Public Markets: High Sensitivity and Negative Elasticity
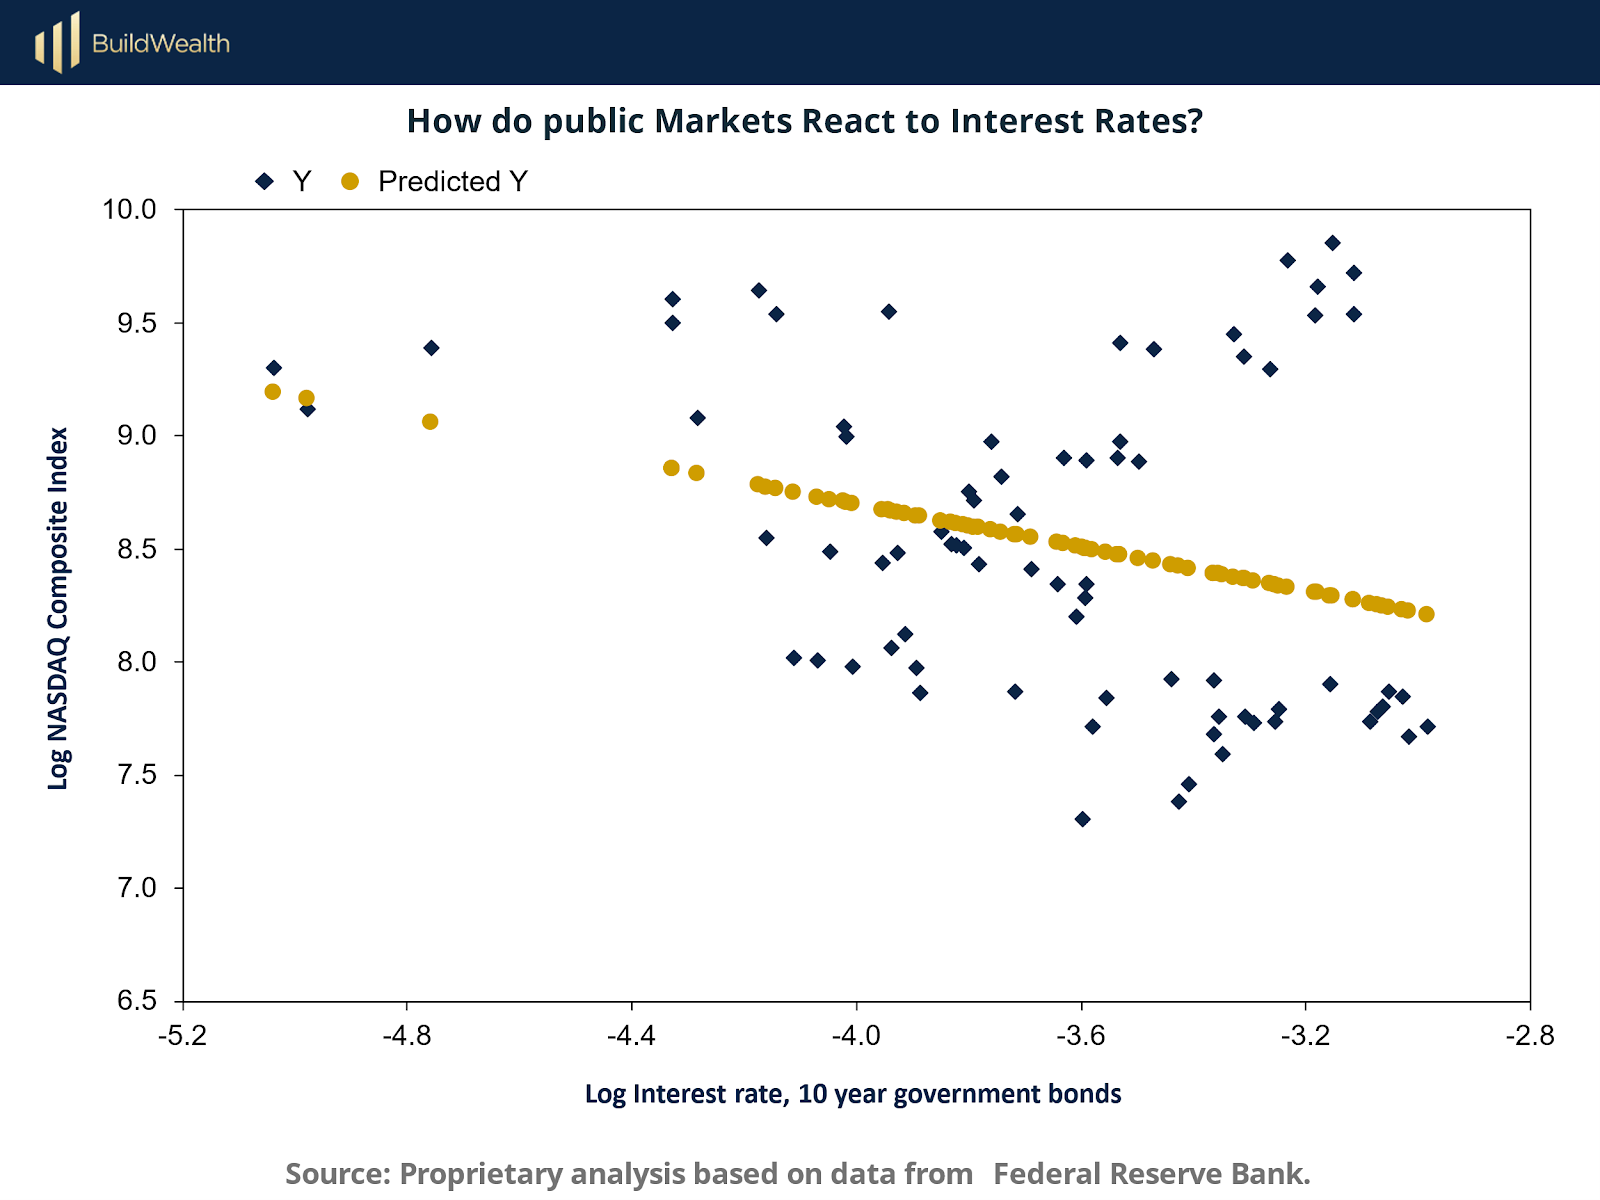
The scatterplot above reveals a clear negative relationship between long-term interest rates and the NASDAQ Composite Index. As yields increase, valuations fall—a reflection of discount rate effects on future cash flows, increased equity risk premia, and diminished investor appetite for growth. The predicted values, shown in gold, track a relatively steep downward trend, consistent with high rate sensitivity.
The OLS regression coefficient for the NASDAQ Composite Index is −0.4785, while the NASDAQ 100 shows even greater sensitivity at −0.5706. These elasticities imply that a 1% increase in long-term rates (in log terms) correlates with a roughly 0.5% drop in the index, reflecting a strong market reaction.
Private Markets: Milder Reaction, Structural Insulation
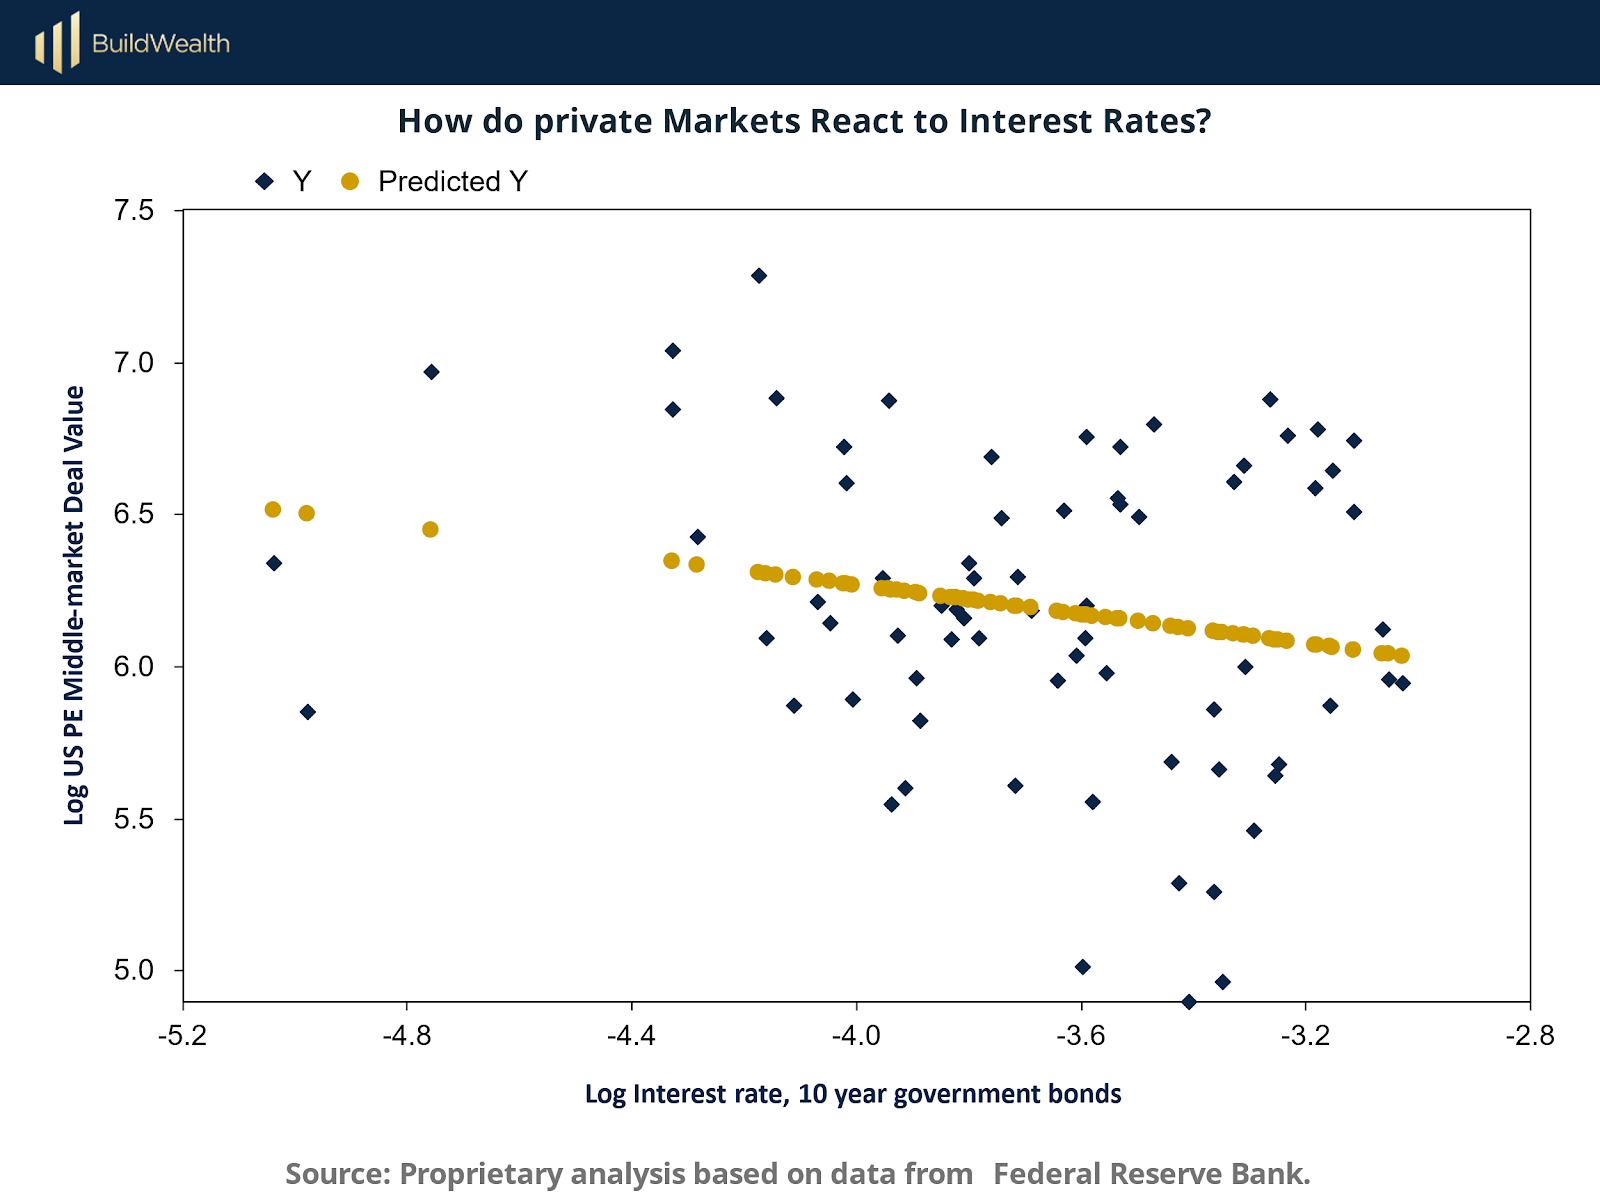
In contrast, private equity valuations—measured here through middle-market deal value—demonstrate a far weaker relationship with interest rates. The predicted values in the scatterplot slope downward only slightly, indicating that while monetary conditions do matter, their impact is muted compared to public equities.
The OLS coefficient is −0.2307, less than half the NASDAQ 100’s sensitivity. This weaker relationship is not surprising given the structural features of private equity: long investment horizons, illiquidity, negotiated valuations, and operational value creation over market timing.
Visual Summary: Public vs. Private Sensitivity
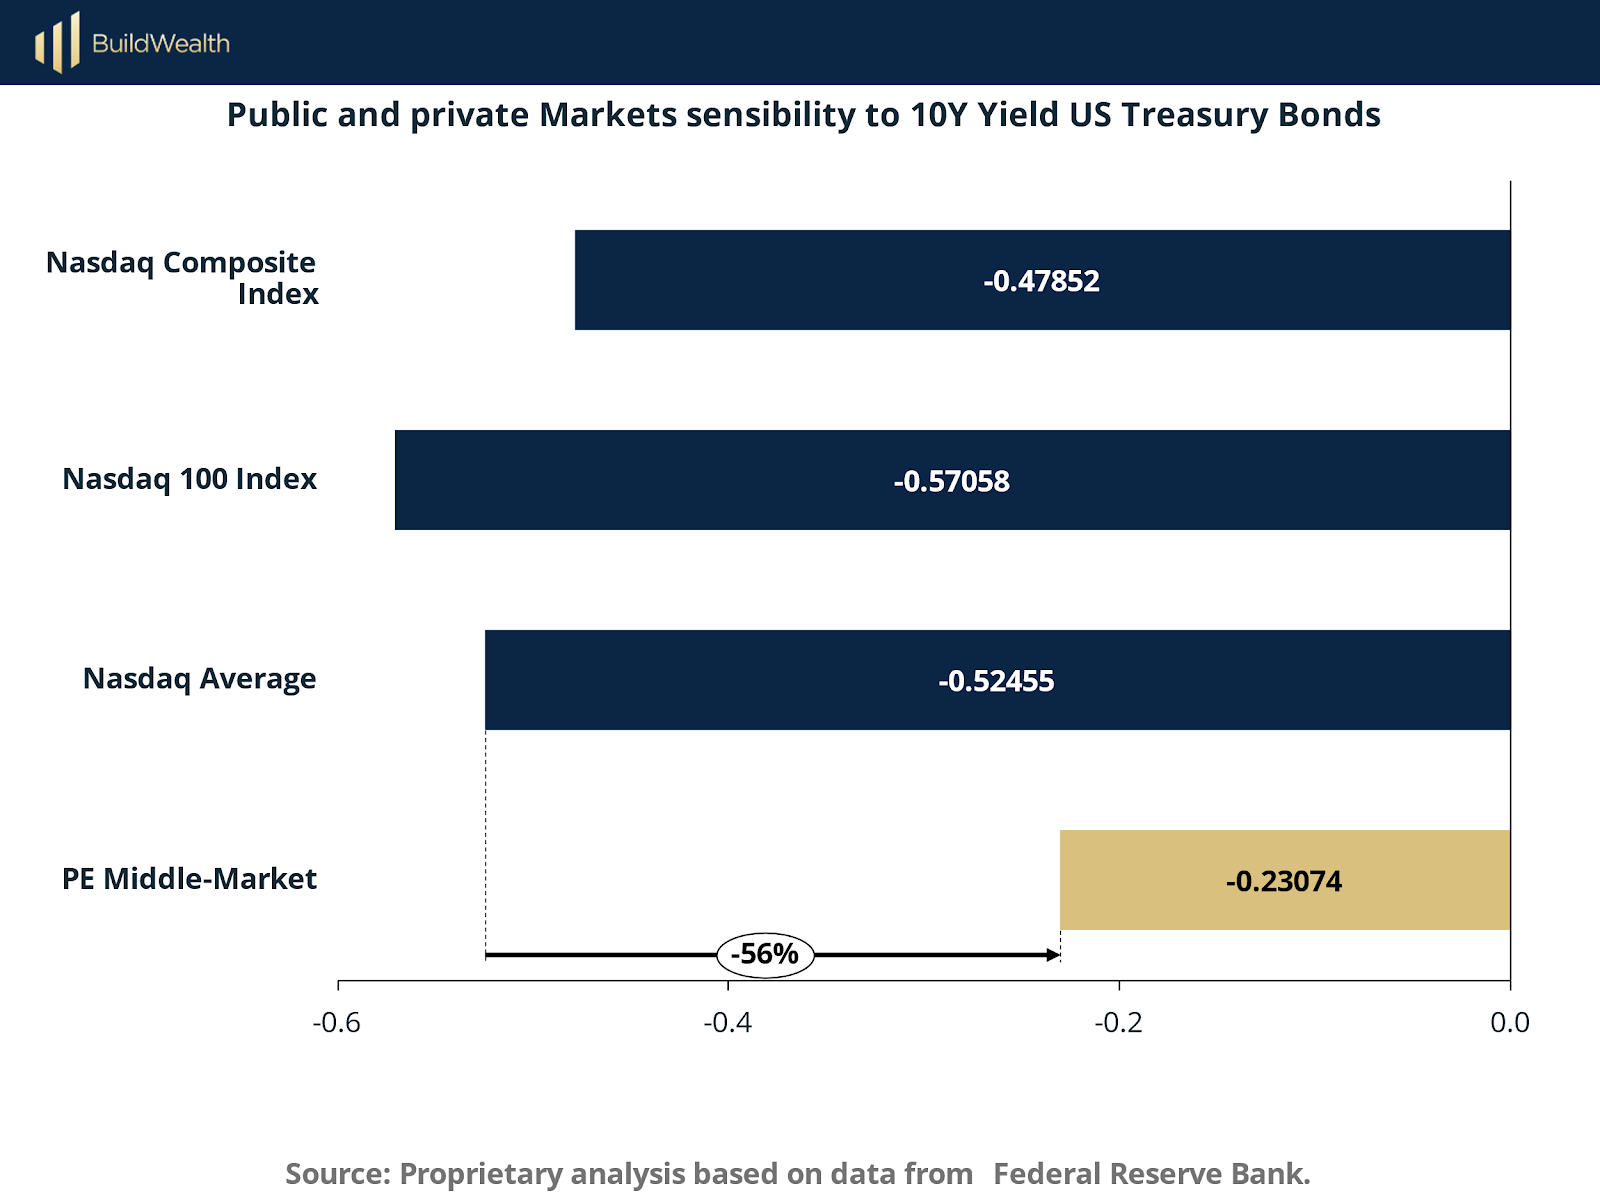
This bar chart distills the regression results, showing that the average NASDAQ sensitivity (−0.5245) is more than double that of PE Middle-Market (−0.2307). Public market valuations are thus more directly exposed to interest rate volatility and macro sentiment, whereas private markets exhibit a degree of resilience and valuation stickiness.
2. How Public and Private Markets React to Economic Uncertainty
Periods of heightened economic uncertainty are consistently associated with elevated financial market volatility, particularly in public equities. This section examines how uncertainty shocks propagate through asset classes by comparing their annualized volatility responses to fluctuations in the Equity Market-related Economic Uncertainty Index.
Uncertainty Cycles and Systemic Impact
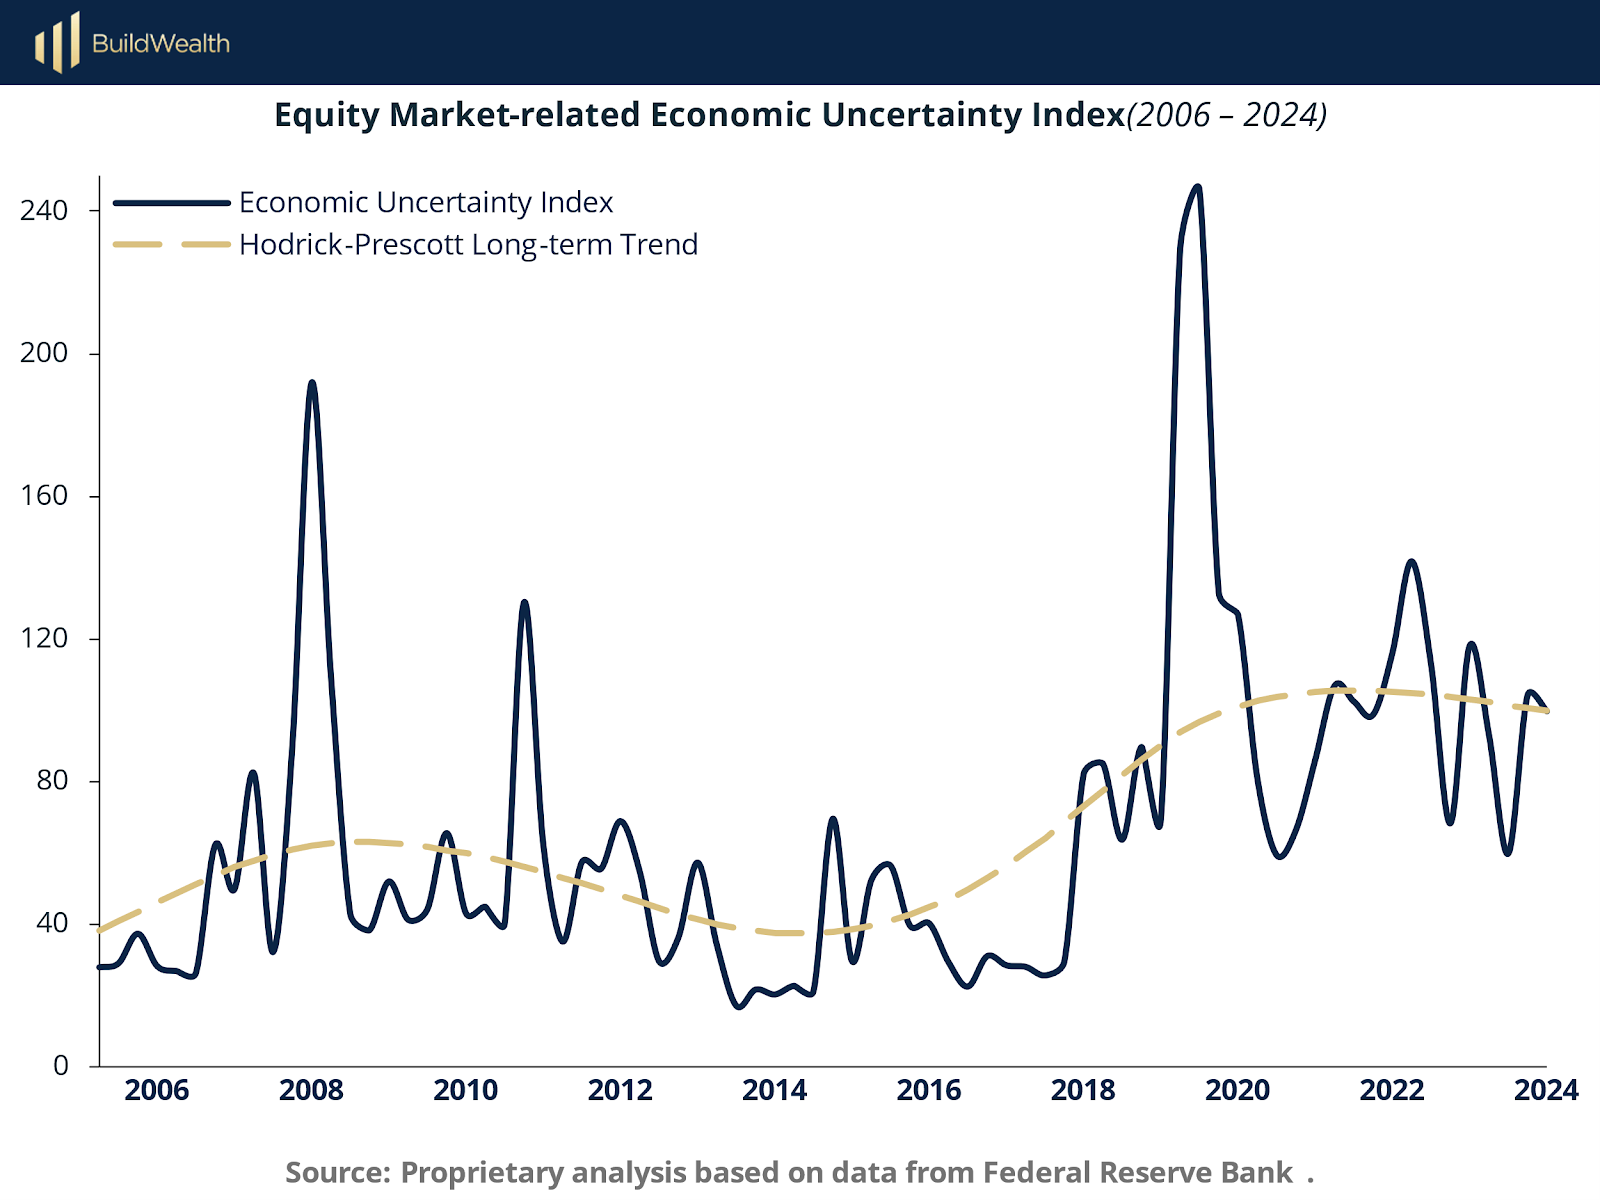
The chart above captures the cyclical behavior of macro uncertainty from 2006 through 2024. Spikes typically coincide with major macroeconomic shocks: the 2008 global financial crisis, the 2011 debt ceiling standoff, the 2018 trade war, and the 2020 COVID-19 pandemic. These periods mark the onset of intense repricing and behavioral shifts across financial markets.
Critically, each upward spike in the index reflects not just higher volatility, but wider forecast error, increased investor hesitancy, and sharper swings in capital allocation, particularly within liquid instruments.
Volatility Response Across Market Types
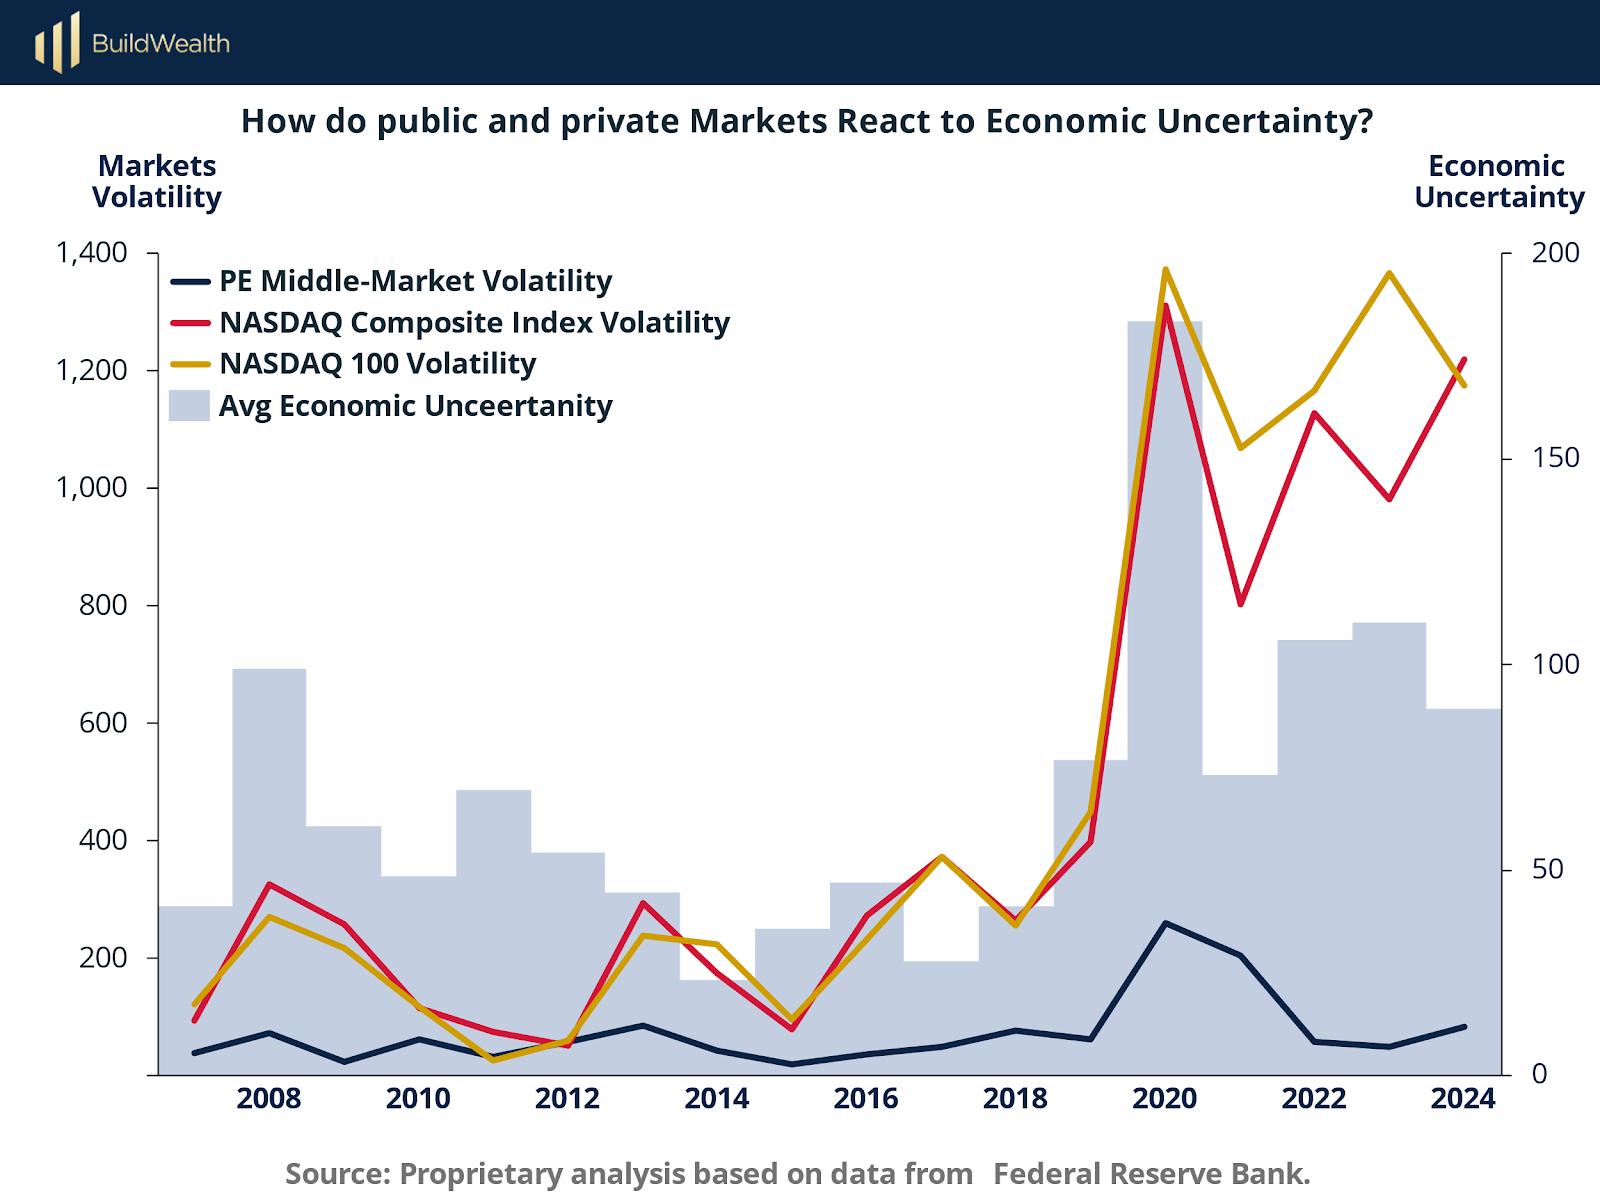
This chart plots annualized standard deviations for three asset classes—NASDAQ Composite, NASDAQ 100, and U.S. Private Equity Middle-Market—against the backdrop of the average uncertainty level for each year. It reveals a pronounced asymmetry in the way these markets react.
Public markets (NASDAQ Composite and NASDAQ 100) show a direct and immediate rise in volatility when uncertainty spikes. In 2020, NASDAQ volatility surged above 1,200 points, mirroring the steep climb in the uncertainty index during the COVID-19 shock.
In contrast, PE Middle-Market volatility remained markedly lower, even during peak uncertainty periods. While there was some uptick in 2020, the rise was modest and short-lived.
This divergence highlights a structural resilience in private markets. The absence of daily repricing, the illiquidity premium, and commitment-based capital structures all contribute to a reduced feedback loop between macro headlines and valuation behavior.
Implications for Portfolio Construction
From a strategic perspective, these findings reinforce the argument for diversified exposure to private markets during unstable macroeconomic regimes. Public market portfolios, while liquid and responsive, are prone to amplifying short-term shocks due to sentiment-driven trading and algorithmic price discovery. On the other hand, private equity acts as a volatility dampener, allowing investors to remain insulated from transitory macro noise while staying invested through the cycle.
3. Public Equity Markets: Volatility Amplification and Sensitivity to Macro Drivers
To understand how macroeconomic volatility translates into asset-level risk, we analyze the sensitivity coefficients (π, φ) and the corresponding volatility amplification ratios (δ/δ) for public equity indices and the U.S. private equity middle-market. The table below summarizes the results of ordinary least squares regressions using logarithmic transformations of market values and key macroeconomic drivers: the 10-year U.S. Treasury bond yield, the Federal Funds Effective Rate, and the Equity Market-related Economic Uncertainty Index.

Public Markets: High Sensitivity and Amplification
The regression coefficients for the NASDAQ Composite and NASDAQ 100 indices confirm that public equities are significantly exposed to macro volatility:
The coefficient π (interest rate sensitivity) is −0.48 for the NASDAQ Composite and −0.57 for the NASDAQ 100. These elasticities are statistically significant and indicate a steep negative relationship between interest rates and market valuations.
The coefficient φ (economic uncertainty sensitivity) is 0.45–0.54, also significant, showing that uncertainty shocks are positively correlated with market volatility.
More striking are the δ/δ ratios, which quantify how much market volatility arises per unit of volatility in the macro driver:
δ/δπ exceeds 428,000 for the NASDAQ Composite, meaning that even modest rate volatility leads to outsized swings in equity values.
δ/δφ, the volatility-amplification ratio to uncertainty, is over 100, confirming that public markets not only respond to uncertainty—but overreact to it.
Private Markets: Lower Sensitivity and Statistical Safety
In contrast, the U.S. private equity middle-market shows much lower sensitivity and statistically insignificant exposure to uncertainty:
The coefficient π is −0.23, indicating moderate sensitivity to interest rates.
The coefficient φ is just 0.11 and does not pass conventional significance thresholds, meaning that private equity valuations are statistically unaffected by fluctuations in economic uncertainty.
This insulation is further emphasized by the δ/δ ratios:
δ/δπ is just 24,505—18 times lower than public equity averages.
δ/δφ is only 5.90, compared to more than 100 in public markets.
These results underscore that private equity valuations are not only less volatile, but also far less sensitive to the broader macroeconomic environment, particularly uncertainty shocks.
Conclusion: Why the Wealthiest Invest Beyond Volatility
This report has shown that volatility is more than a short-term inconvenience—it is a structural threat to wealth accumulation. In public markets, the combination of high liquidity, algorithmic trading, and macro-driven sentiment causes price swings that often far exceed changes in fundamentals. These swings are especially pronounced during periods of rising interest rates and economic uncertainty, where public equity valuations become highly reactive, if not outright unstable.
In contrast, private equity—particularly within the U.S. middle-market segment—exhibits far lower sensitivity to these macro shocks. Its valuations are not only less volatile but also statistically insulated from short-term uncertainty. This difference is not incidental; it is structural. Private markets are built around long-term value creation, operational improvement, and disciplined capital deployment—not daily price discovery or liquidity-driven momentum.
This is precisely why ultra-high-net-worth individuals (UHNWIs) and institutional investors increasingly allocate significant portions of their portfolios to illiquid, long-duration assets. These investors recognize that wealth is preserved not by chasing short-term gains, but by reducing exposure to volatility and aligning capital with strategies that compound steadily over time. In uncertain macroeconomic regimes—like the one we now face—such positioning becomes even more critical.
The data in this report reinforces our investment philosophy: Stable capital grows best in stable structures. Public markets serve liquidity needs, but private markets preserve long-term value. And for those building or protecting generational wealth, that distinction makes all the difference.
Sources & References
Baker, Scott R., Bloom, Nick and Davis, Stephen J., Equity Market-related Economic Uncertainty Index [WLEMUINDXD], retrieved from FRED, Federal Reserve Bank of St. Louis; https://fred.stlouisfed.org/series/WLEMUINDXD, June 4, 2025.
Board of Governors of the Federal Reserve System (US), Federal Funds Effective Rate [DFF], retrieved from FRED, Federal Reserve Bank of St. Louis; https://fred.stlouisfed.org/series/DFF, June 4, 2025.
Board of Governors of the Federal Reserve System (US), Market Yield on U.S. Treasury Securities at 10-Year Constant Maturity, Quoted on an Investment Basis [DGS10], retrieved from FRED, Federal Reserve Bank of St. Louis; https://fred.stlouisfed.org/series/DGS10, June 4, 2025.
NASDAQ OMX Group, NASDAQ 100 Index [NASDAQ100], retrieved from FRED, Federal Reserve Bank of St. Louis; https://fred.stlouisfed.org/series/NASDAQ100 June 4, 2025.
NASDAQ OMX Group, NASDAQ Composite Index [NASDAQCOM], retrieved from FRED, Federal Reserve Bank of St. Louis; https://fred.stlouisfed.org/series/NASDAQCOM, June 4, 2025.
PE150. (2025). Moody’s Downgrades U.S. Credit Rating Over Fiscal Risk and Inflation. https://www.pe150.com/p/moody-s-downgrades-u-s-credit-rating-amid-rising-fiscal-concerns-1830
PE150. (2025). The State of Private Equity Middle-Market in US. https://www.pe150.com/p/the-state-of-private-equity-middle-market-in-us
Pitchbook. (2024). US PE Middle Market Report. https://files.pitchbook.com/website/files/pdf/2024_Annual_US_PE_Middle_Market_Report.pdf
Premium Perks
Since you are an Wealth Stack Subscriber, you get access to all the full length reports our research team makes every week. Interested in learning all the hard data behind the article? If so, this report is just for you.

Want to check the other reports? Visit our website.